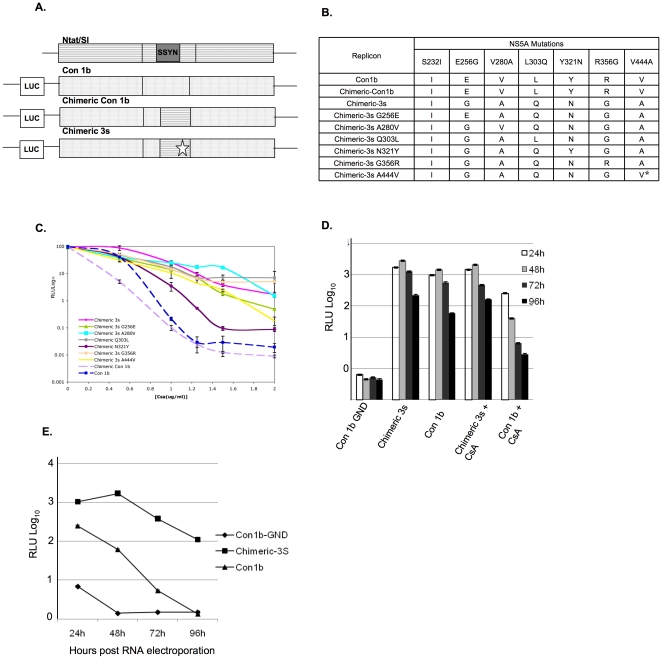
Figure 2. CsA sensitivity of different chimeric 3s replicons.
(A) Schematic representation of different Chimeric replicons derived from Con1b and Ntat/SI. Star represents all 3s mutants (acc. no. EF115302), SSYN insert present only in 1bN replicon. = Con1b sequence, = 1bN sequence. (B) List of cyclosporine resistant mutations cloned in a con 1b background. Star indicates reversion of that particular amino acid. (C) Equal numbers of replicon cells were seeded for the Con 1b, Chimeric Con1b, and Chimeric 3s variants. The cells were treated with different concentrations of CsA as indicated on the x axis and assayed for luciferase activity. The y axis shows relative light units Log values (RLULog10). Error bars represent standard deviations from three separate experiments read in triplicate. Student's t test was used to calculate p values. Con 1b vs Chimeric 3s N321Y P<0.0001 at 1, 1.5, and 2.0 µg/ml CsA. Chimeric 3s N321Y vs Chimeric 3s P<0.0001 at 1, 1.5, and 2.0 µg/ml CsA. (D) Huh7.5 cells were electroporated with Chimeric Con1b and Chimeric 3s replicon RNA and plated in either the presence or absence of 1.0 µg/ml CsA. Equal numbers of cells were harvested at 24, 48, 72, and 96 hours and analyzed for luciferase activity (RLULog10). Three independent RNA electroporations were performed and average luciferase readings are presented for the indicated time points. Error bars represent standard deviation (E) Huh7.5 cells were electroporated as in (D) except the cells were pretreated with 1.0 µg/ml CsA for 6 days and plated in the presence of drug. Equal numbers of cells were collected and luciferase activity was analyzed (RLULog10). The average of three independent RNA electroporations is presented. Error bars represent standard deviation.

