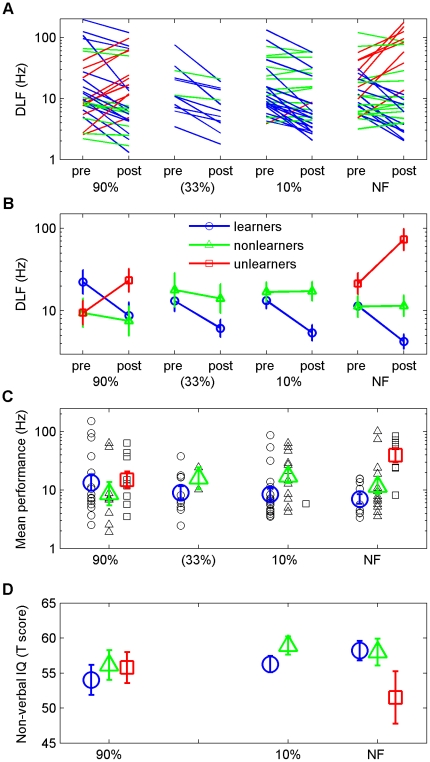
Figure 3. Individual and learning-subgroup data.
(A) Individual DLFs on the pre- and post-training probes. Listeners who showed no change in DLFs (‘non-learners’; the change in DLF was less than a factor of √2, which was the step size of the adaptive staircase) are marked in green, those who showed learning (‘learners’) are marked in blue, and those who showed worse performance on the post-test compared to the pre-test (‘unlearners’) are marked in red. The 33% group are included in the figure for comparison but excluded from statistical analysis. (B) Group means of pre- and post-test DLFs by learning subgroup. (C) Average performance (mean of pre- and post-training DLFs) displayed by group and subgroup. (D) Standardized (T) score on the WASI [44] Matrices subtest used to assess non-verbal IQ. All data are represented as means +/− SEM.

