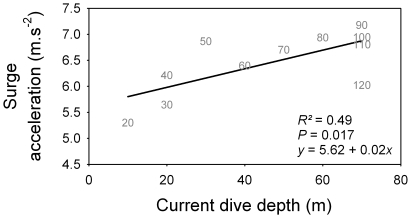
Figure 3. Relationship between peak in surge acceleration for different maximum dive depth categories and current dive depth.
For positioning of peaks, see Fig. 2. Each data point is symbolized by a number representing maximum dive depth category. The deepest category (120–130 m) was excluded from the regression (see Fig. 2).

