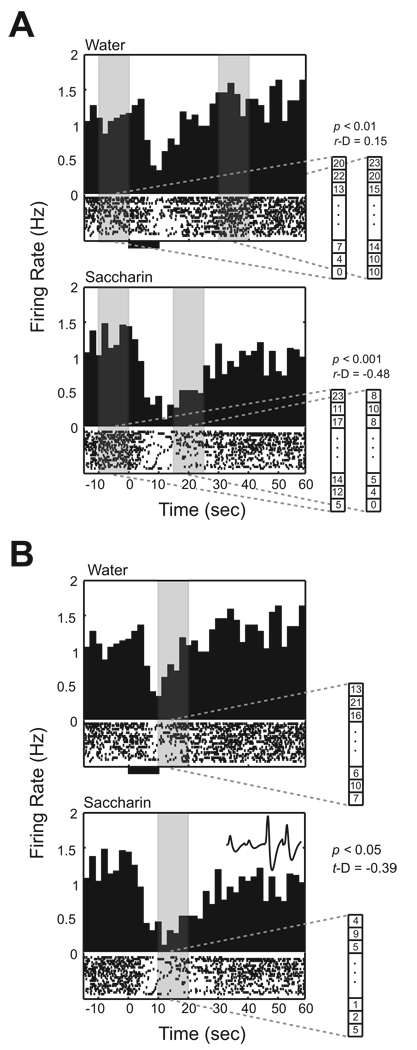
Figure 2. Taste responsiveness of BLA neuron.
The examples of unit activity illustrate how taste responsiveness is determined. Individual neuronal spikes obtained during randomly alternating trials between saccharin and water infusions are sorted according to trial type. The upper peristimulus time histogram (PSTH) represents data collected during water trials, and the lower PSTH shows unit firing during saccharin trials. At the bottom of each PSTH, a raster plot represents the spike activity for each trial. In the raster, the lowest line corresponds to the first trial and subsequent trials are stacked above. All trials are aligned with the initiation of water and saccharin infusions (T0). A thick line below the raster plot indicates the time period of the 10 sec infusion. An average waveform of the unit sampled by the tetrode is shown at the right-upper corner of the lowest PSTH. A. Baseline comparison. The baseline comparison was applied separately according to the trial type for a cell. The unit activity in this example was obtained from a conditioned rat. The sliding method detected an excitatory response (T30 to T40) for water and a suppressive response (T15 to T25) for taste trials. These time frames are indicated by the regions of gray shading. B. Taste comparison. The taste comparison was applied to the same unit in A. This unit demonstrates suppressive activity during saccharin trials compared to water trials. The largest suppression is detected 10 sec after the infusion started (p = 0.000592; D = −0.39) indicated by the shaded gray region.

