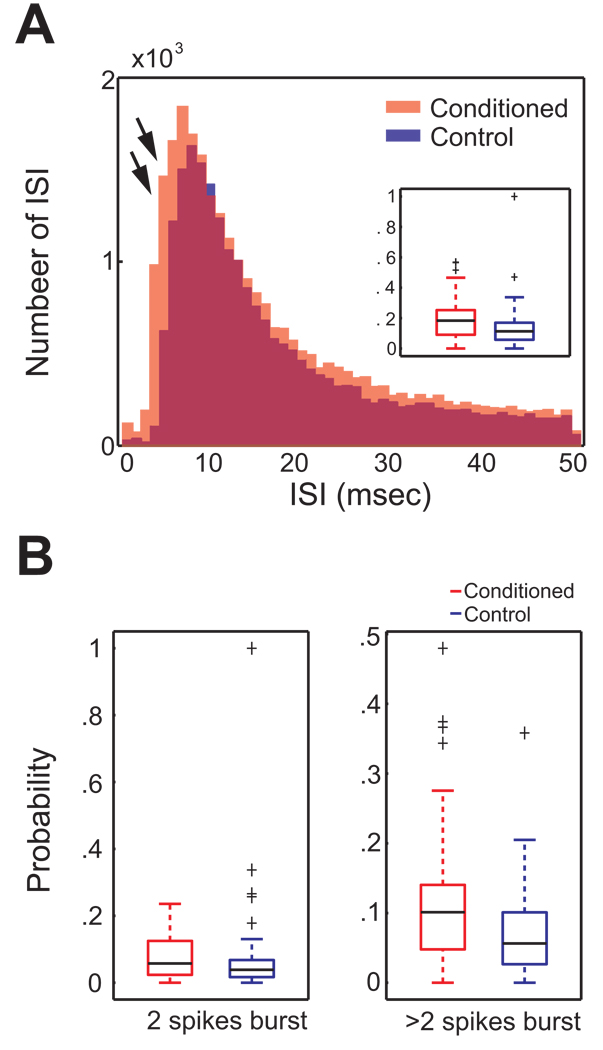
Figure 5. Conditioning effect on short interspike intervals of BLA cells.
A. The interspike interval (ISI) frequency histogram (range = 0 ~ 50 msec) was generated for the total number of ISIs for both groups (conditioned group = red; control = blue). Superimposed ISI frequency histogram reveals a higher occurrence of 3~7 msec ISIs in the conditioned group than the control (double arrows). Inset. The boxplot shows that the probability of occurrence of 3~7 msec burst ISI was higher in the conditioned animals. Group medians of the probability and extreme values (cross symbols) are indicated with black. B. Comparisons of the probability of occurrence of 2 spike bursts and > 2 spike bursts across the conditioned and control groups. (Left) A boxplot depicting the probability of occurrence of 3~7 msec ISI bursts containing only 2 spikes. No statistically significant, but a marginal group difference is detected (p = 0.07). (Right) A boxplot representing the probability of occurrence of bursts with more than 2 spikes. The probability of occurrence of 3~7 msec ISIs containing more than 2 spikes was significantly higher in the conditioned group than the control.

