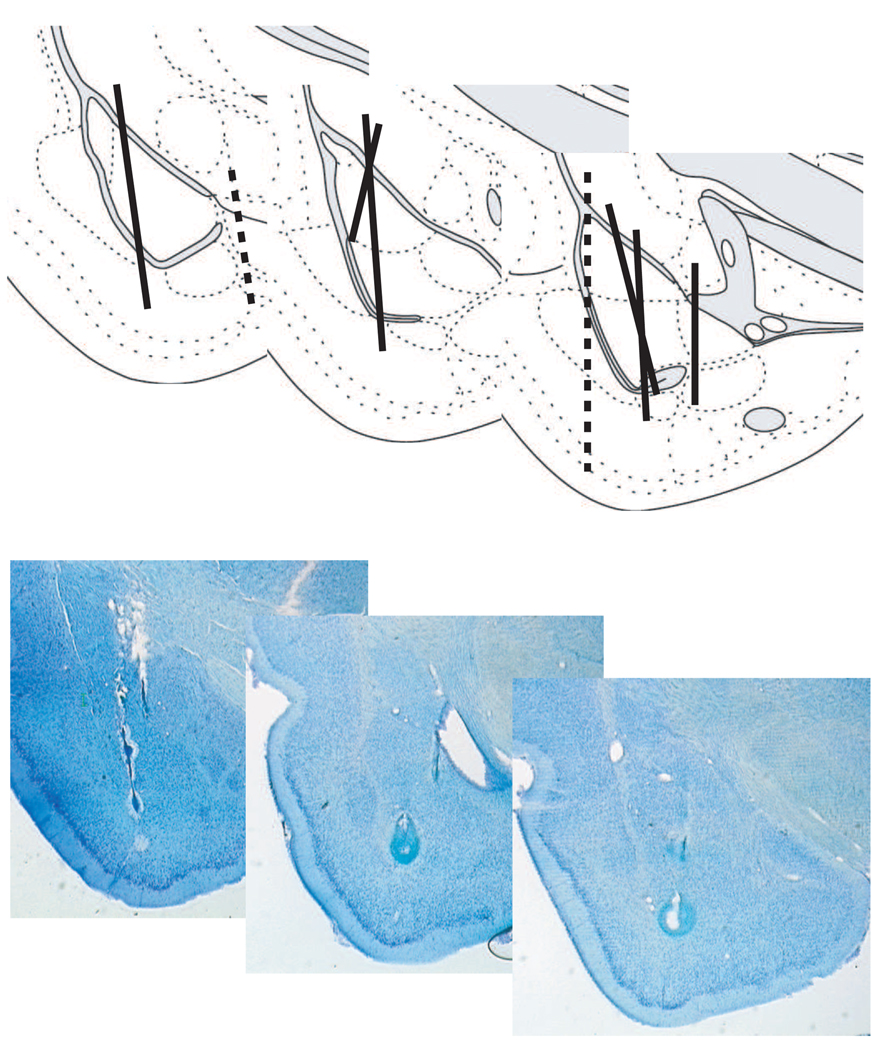
Figure 6. Histological verification of recording.
(Top) A reconstruction of the recording tracks in the left BLA from seven animals. The left illustration shows the anterior portion of the BLA, while the right depiction represents the posterior BLA. Dashed tracks represent tetrodes that were implanted outside the BLA. Data from dashed sections are not included in the analysis. (Bottom) Photomicrographs of cresyl violet stained sections from three different rats, depicting the electrolytic marking lesions within the BLA.

