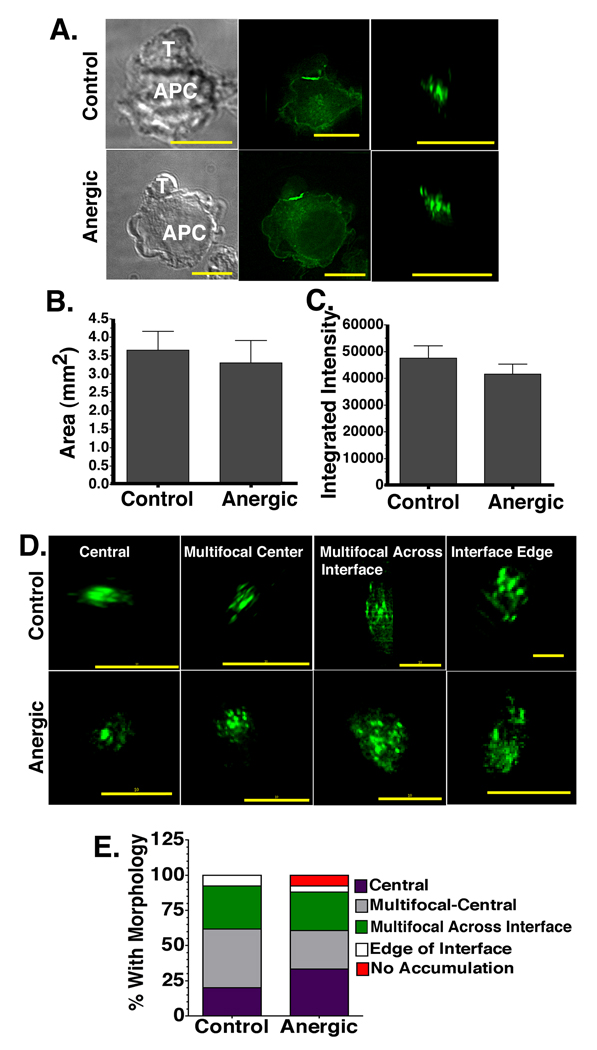
Figure 3. The amount, spatial distribution, and total area of accumulated MHC:peptide at the anergic immunological synapse is similar to control synapses.
(A) DIC (left) and fluorescent images (center) of T-APC conjugates. The en face view of the T-APC interface is also shown (right). (B) The total area and (C) integrated intensity of accumulated MHC:peptide complexes ≥2 fold above background in en face views as in A. (D) Examples of MHC:peptide morphology at the T-APC interface for both control and anergic T cells. (E). Frequency of the distinct MHC:peptide accumulation morphologies identified in D. This is a single experiment representative of 7 separate experiments with more than 500 total control and anergic synapses imaged. There were 127 control synapses and 131 anergic synapses in the experiment compared in E. All images were collected with 60× objective. Size bar = 10µm.

