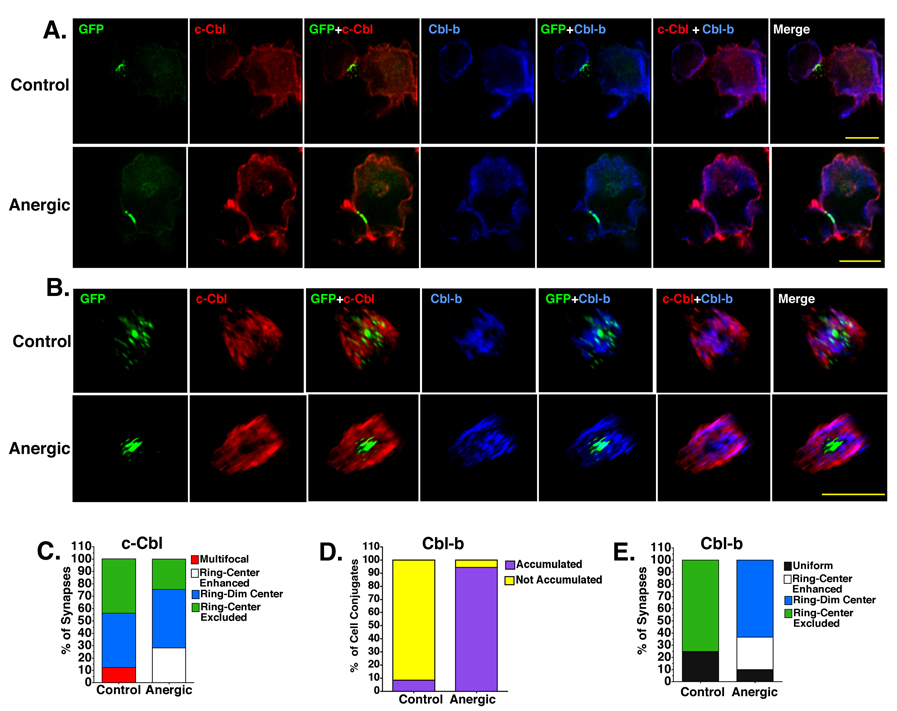
Figure 5. Cbl-b and c-Cbl are accumulated in the pSMAC of both control and anergic synapses and Cbl-b is also localized to the cSMAC in anergic cells only.
(A) T-APC conjugates showing the accumulation of GFP-tagged MHC:peptide (green) c-Cbl (red) and Cbl-b (blue) at the T-APC interface. Intensity and brightness settings for each image in each panel are identical so perceived differences in brightness are representative of differences in staining intensity. (B) En face views of the synapses shown in A. Note: to allow visualization of all molecular species in the en face views, the intensity and contrast settings are NOT identical. Perceived differences in intensity do not reflect actual differences in staining intensity. Images are representative of 7 separate experiments and more than 500 images of both control and anergic cells. All images were collected with 60× objective. Size bar = 10µm. (C). The spatial distribution of c-Cbl at the control and anergic synapses. (D) The frequency of Cbl-b accumulation at the T-APC interface ≥2 fold above background for control and anergic cells. (E). Spatial distribution of Cbl-b is markedly different for control and anergic T cells.

