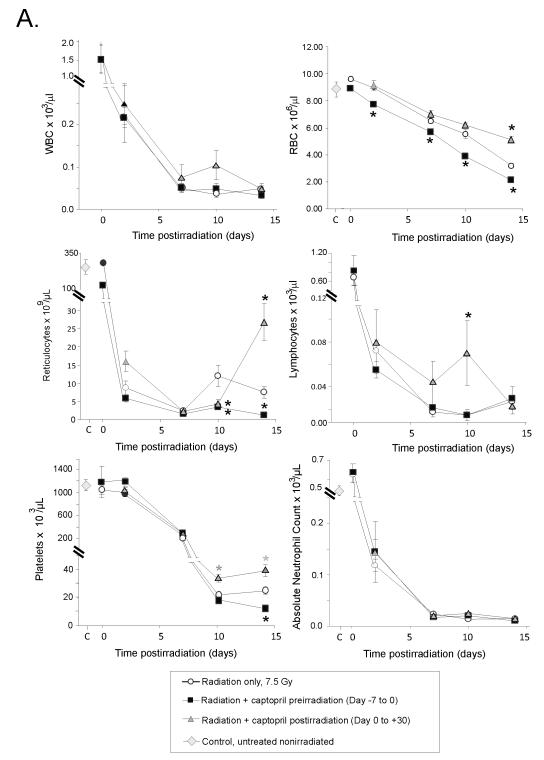
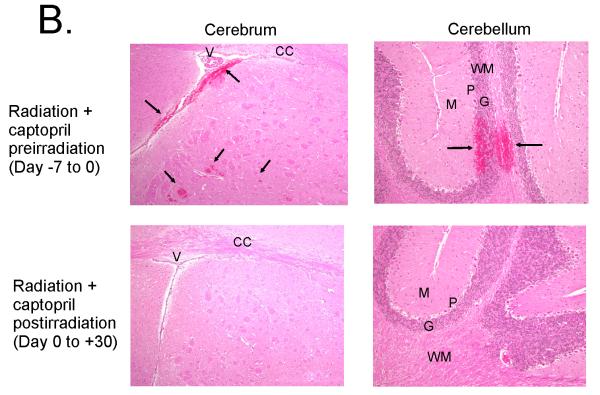
Figure 3. Effect of captopril administration on radioprotection.
Mice received no treatment or were administered captopril in their drinking water before (day −7 to day 0= day of irradiation) or after (day 0 [starting 1 hour after irradiation] to day 30) exposure to 7.5 Gy 60Co gamma total body irradiation. (Panel A) Peripheral blood white blood cells (WBC), red blood cells (RBC), reticulocytes, lymphocytes, platelets, and absolute neutrophils from irradiated mice, samples were taken at 2 hours (indicated on day 0), 2 7 10 or 14 days postirradiation. Control blood cell levels in untreated, nonirradiated mice are also indicated for blood cell types, except for lymphocytes (3.84 × 10³ ± 0.4) and WBC (4.4 × 10³ ± 0.5). Data show mean values ± SEM, n = 5-6 mice per group. * p < 0.05 compared with radiation alone cell counts at the same time point. (Panel B) Histological comparison of brain microhemorrhages in the subcortical cerebrum (100 × magnification) and cerebellar cortex (200 × magnification) of mice at day 14 postirradiation. Representative photomicrographs of hematoxylin and eosin stained tissue for mice treated with captopril prior to (upper panels with hemorrhage) or following (lower panels, normal brain) radiation exposure. The microhemorrhages are indicated by arrows and occur periventricularly in the subcortical cerebrum; ventricles (V) and corpus callosum (CC) are identified for orientation. Microhemorrhages also occured perivascularly in the cerebellar cortex extending from the white matter (WM) through the granular (G) and piriform/Purkinje (P) layers, abutting the molecular (M) layer.


