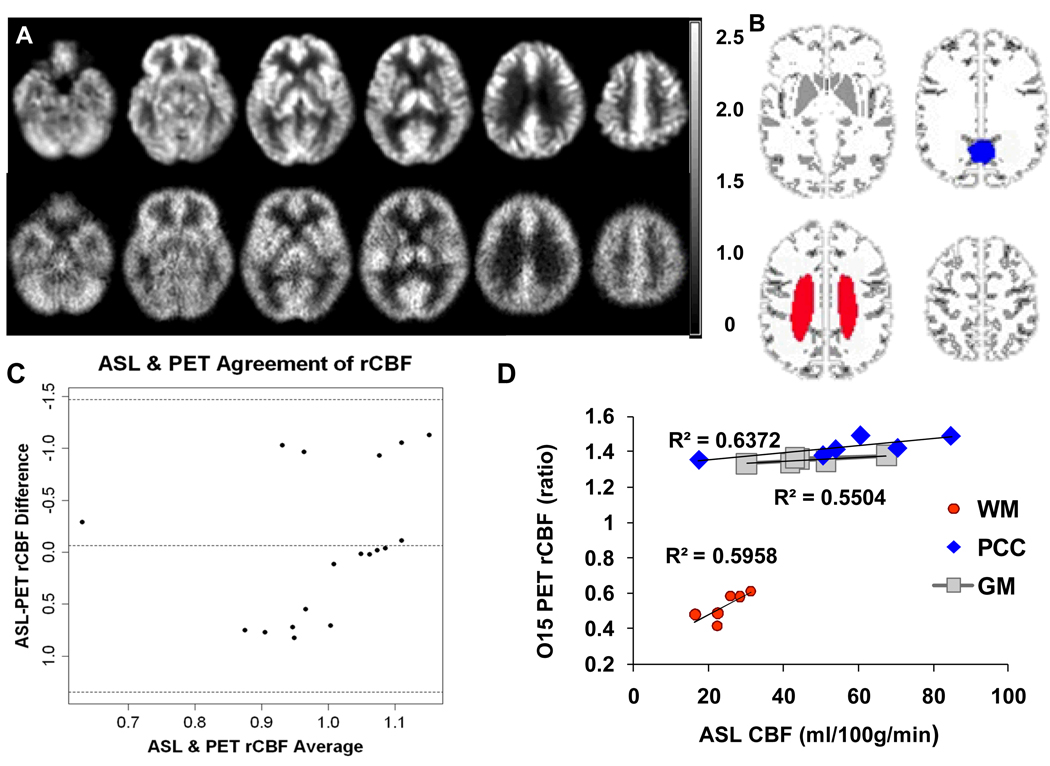
Figure 2.
A. Grand mean normalized regional CBF (rCBF) images from one 60-year old control with normal cognition using pcASL-MRI (upper row) and 15O-water PET (bottom row) method. The rCBF images are in the same ratio scale; B. Mask template shows GM in gray and PCC in blue (WFU PickAtlas Tool). WM ROI is manually drawn for each subject and shown in red. C. Bland-Altman plots show the agreement on rCBF from GM, WM and PCC measured by pcASL-MRI and 15O-water PET methods. D. In the scatter plot, significant correlations were shown in the CBF perfusion values from both the GM, WM and PCC ROIs.

