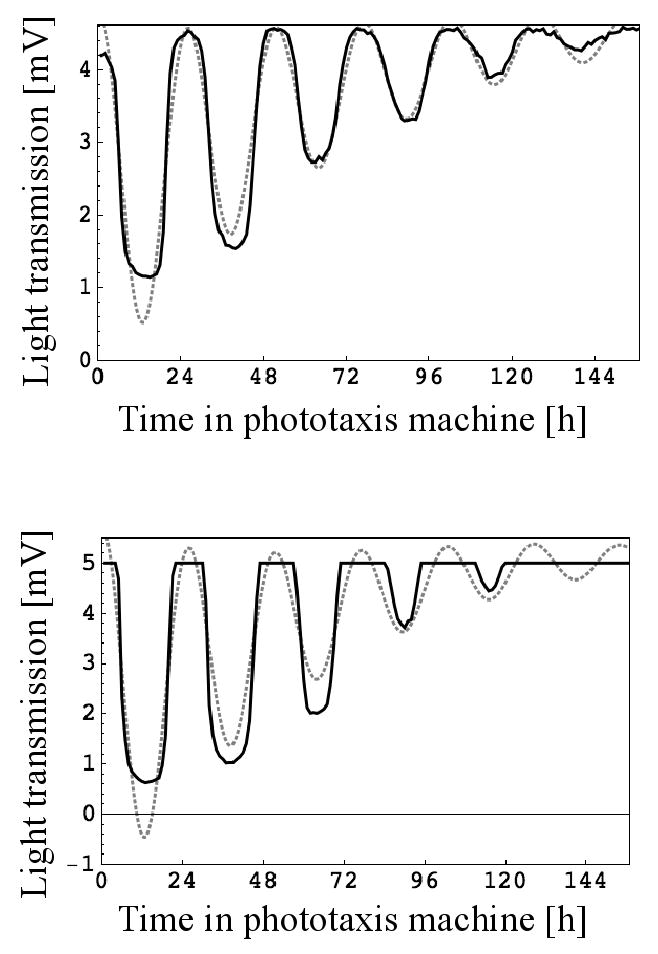
Fig. 1.

Examples for circadian rhythms of phototaxis as monitored by the machine and their analysis. Every hour a test light beam came on for 15 min and light transmission data were collected every minute. Cultures were kept in photoautotrophic medium with dark conditions between test light cycles. In each graph, the transmission data collected 11 min into the test light cycle are plotted as a solid black line and the model of the data created by the algorithm as a dotted gray line. For each graph, the first seven hours of data collection were omitted for optimal analysis. Upper panel: “Normal” rhythm with the light intensity always within the range of the light sensor. Lower panel: “Cut-off” rhythm because the light intensity is beyond the range of the light sensor during times of low phototactic activity.
