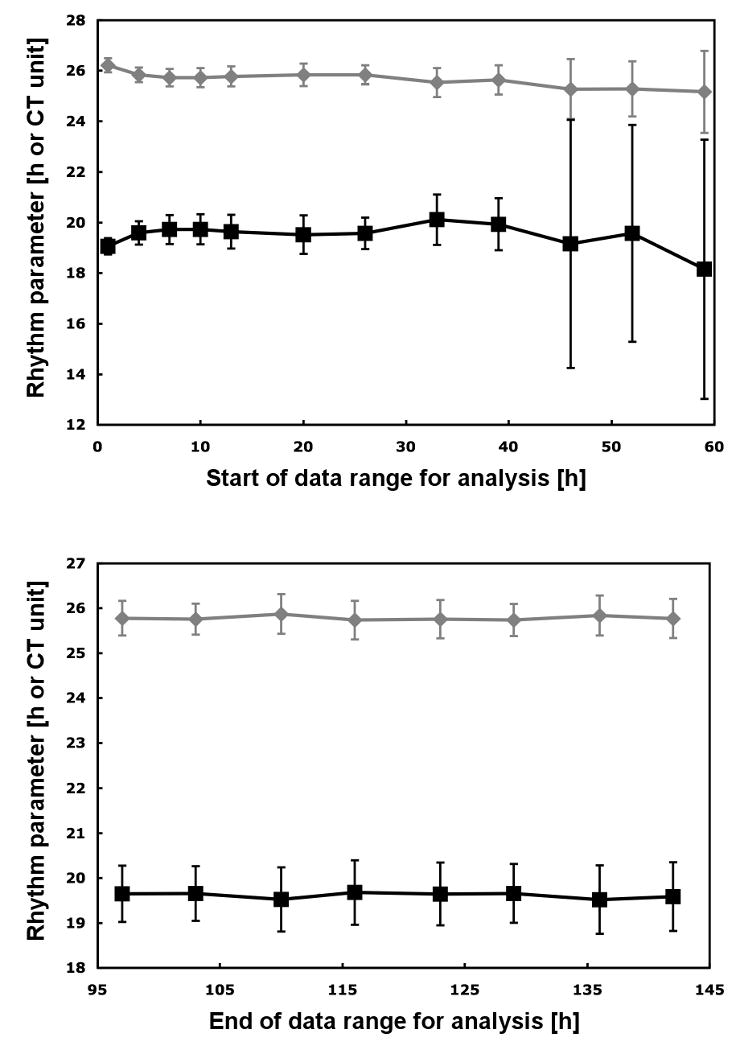
Fig. 3.

Rhythm parameters calculated by the algorithm based on various ranges of the raw data. The period (in h) is shown in gray with diamond symbols and the phase (in CT units) in black with square symbols. Upper panel: Various starting times with a fixed ending time of 136 hours or about 5.25 cycles into the measurements. Lower panel: Various ending times with a fixed starting time of 20 h into the measurement. All period and phase values represent the average of 58 replicate rhythms. Bars indicate the standard deviation.
