
Figure 8.
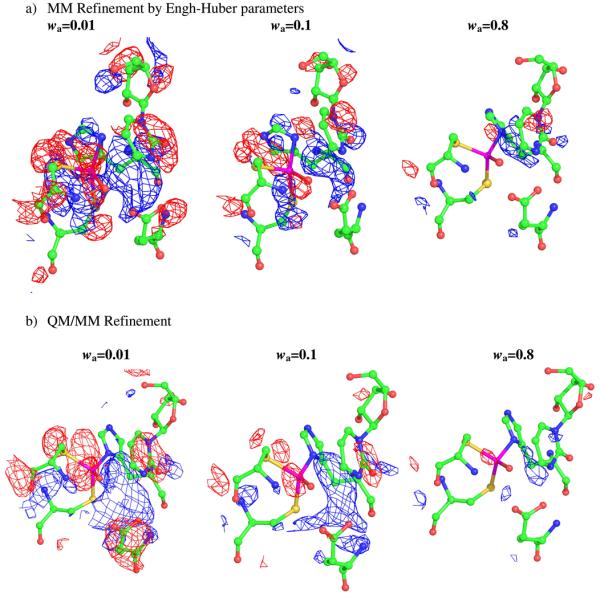
The geometries of the active site of CDA at the end of the refinement runs by QM/MM and MM, together with the electron density maps, Fo − Fc difference electron density maps, contoured at 3σ (blue mesh), and −3σ (red mesh), are shown.
Official websites use .gov
A
.gov website belongs to an official
government organization in the United States.
Secure .gov websites use HTTPS
A lock (
) or https:// means you've safely
connected to the .gov website. Share sensitive
information only on official, secure websites.
The geometries of the active site of CDA at the end of the refinement runs by QM/MM and MM, together with the electron density maps, Fo − Fc difference electron density maps, contoured at 3σ (blue mesh), and −3σ (red mesh), are shown.