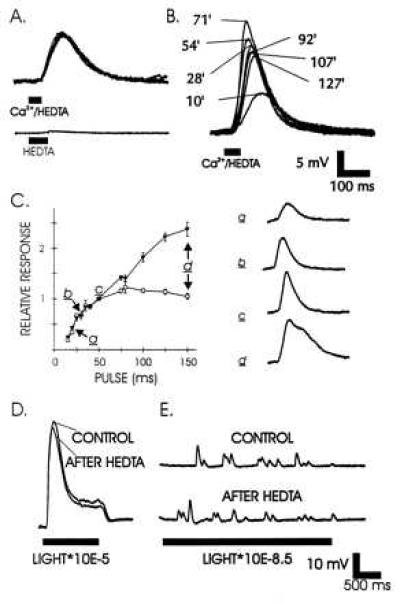
Figure 4.

Characterization of the excitation produced by intracellular pressure injection of 1.8 mM Ca2+/2 mM HEDTA, pH 7.6 solution. (A) Superposed depolarizations produced by five consecutive injections of Ca2+/HEDTA solution (40-ms pressure pulses spaced 1 min apart). Below is the effect of 50 ms pressure pulse injection of 2 mM HEDTA only in a control experiment. (B) Superposed responses to Ca2+/HEDTA injections by 50-ms pressure pulses at times indicated over more than 2 h. (C) Relationship between pressure pulse length and response peak amplitude (open circles) and areas (solid triangles). a–d match amplitude and pulse duration (Left) to voltage trace (Right). Bars represent the standard error of 3–10 measurements over the 2-h experiment. Responses were normalized by dividing response amplitude and area by those of concurrent 50-ms pressure pulse responses. (D) Lack of effect of HEDTA buffer on the light response after >100 injections in the same control experiment. (E) Lack of effect of HEDTA buffer on the response to single photons after >100 injections in the same control experiment. The stimulating light beams were attenuated as indicated.
