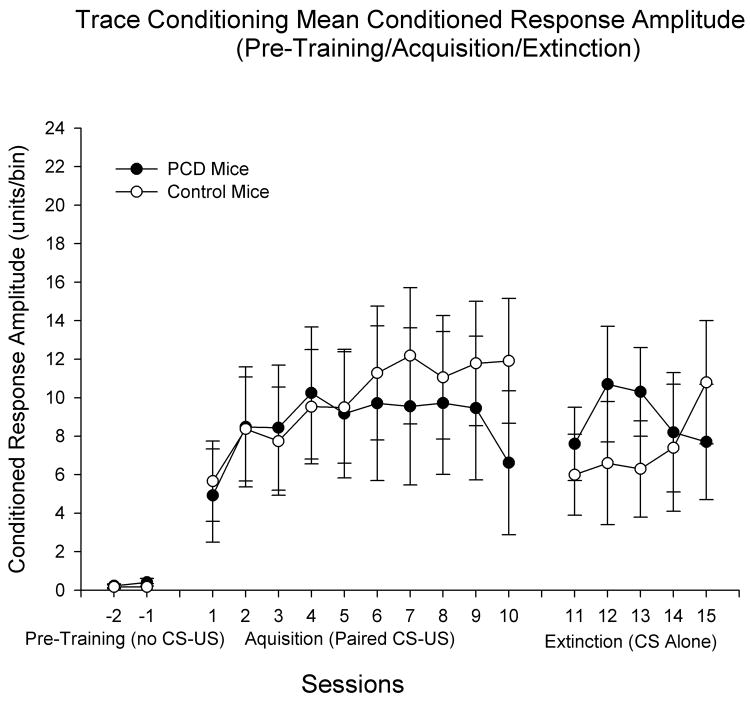
Figure 3.
Trace eyeblink classical conditioning in Purkinje cell degeneration (pcd) mutant mice and wildtype littermate control mice. Peak amplitude of conditioned responses (CRs) are displayed across the three phases of training: (1) pre-training (2 sessions) in which the animals were placed into the experimental apparatus without presentations of the CS or unconditioned stimulus (US); (2) acquisition training (10 daily 100-trial sessions) in which the CS preceded and reliably predicted the US; and (3) extinction training (5 daily 100-trial sessions) in which the CS was presented as in acquisition training, but without US presentations. The duration of pre-training sessions was equal to that of acquisition and extinction sessions (approximately 1 hour). As in the CR percentage measure, CR amplitude does not differ as a function of group in any of the three phases of training. Unlike controls, CR amplitude levels during extinction did not return to initial acquisition levels in pcd mice. Data represent means plus and minus the standard error of the mean. The Ns differ in each phase: Phase 1 (pre-training) – N = 3 pcd; 4 control; Phase 2 (acquisition training) – N = 9 pcd; 12 control; Phase 3 (extinction training) – N = 9 pcd; 8 control.

