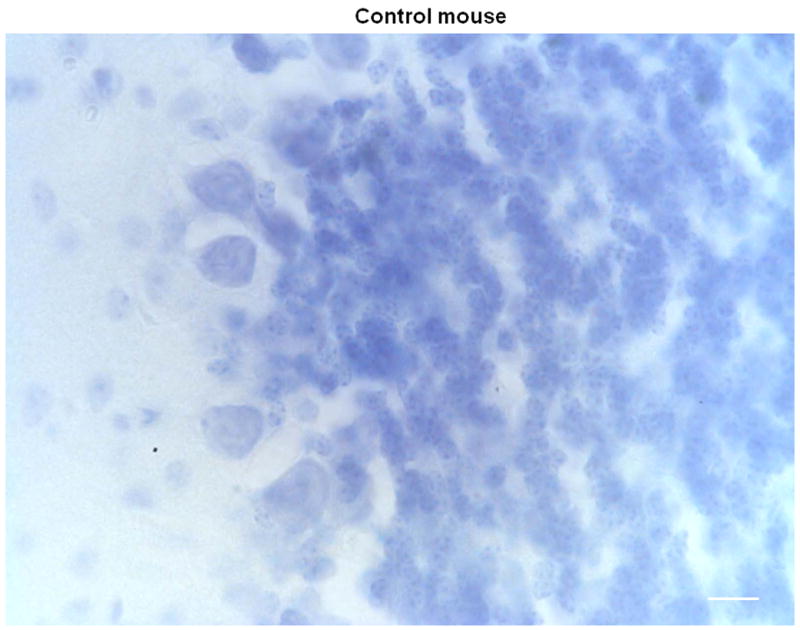
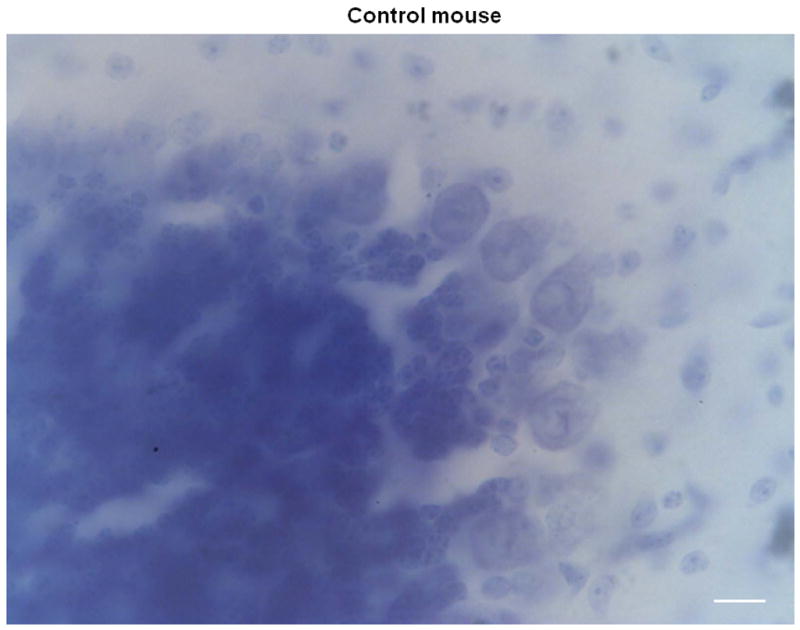
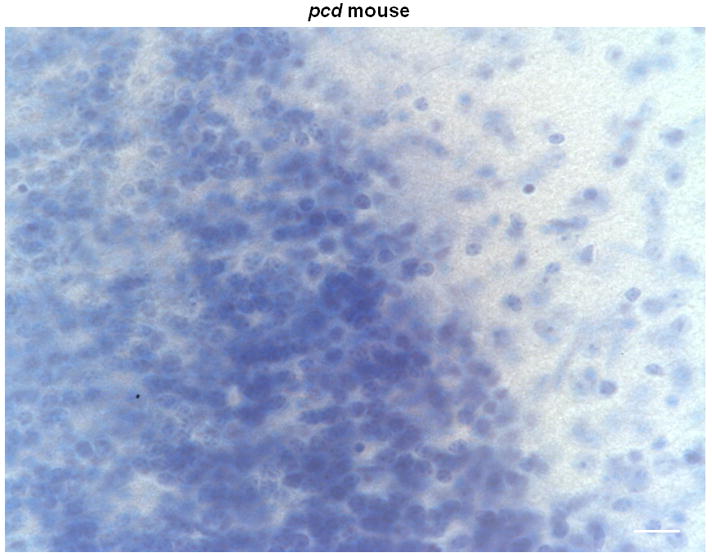
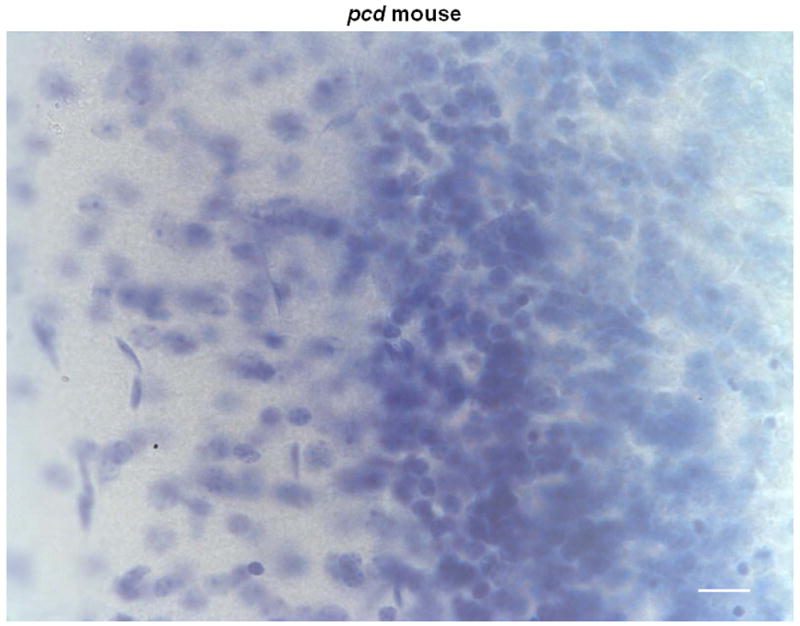
Figure 5.


Representative coronal sections of the cerebellar cortex stained with Thionin in 2 control (A, B) and 2 pcd mice (C, D) magnified at 60x. Note the absence of Purkinje cells in the pcd sections (C, D), while Purkinje cells are abundant in the control sections (A, B). Scale bars = 20 μm.
