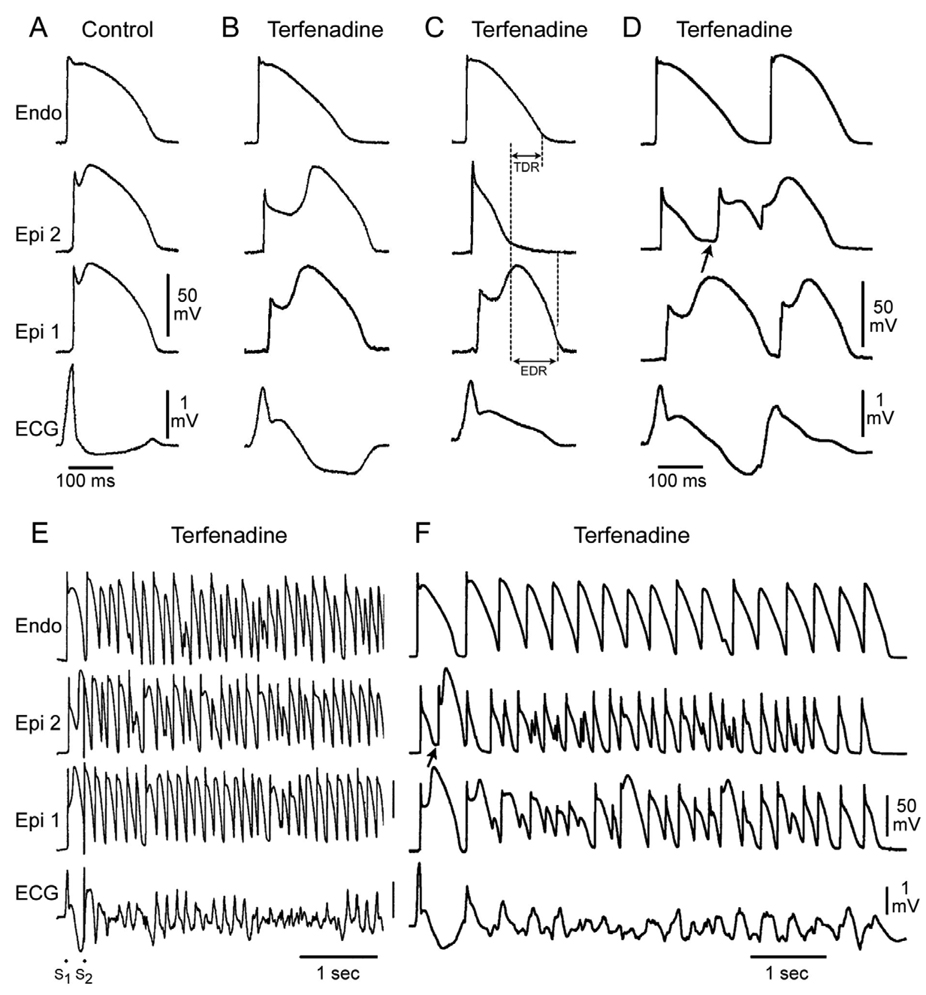
Figure 2.
Cellular basis for electrocardiographic and arrhythmic manifestation of BrS. Each panel shows transmembrane action potentials from one endocardial (top) and two epicardial sites together with a transmural ECG recorded from a canine coronary-perfused right ventricular wedge preparation. A: Control (Basic cycle length (BCL) 400 msec). B: Combined sodium and calcium channel block with terfenadine (5 µM) accentuates the epicardial action potential notch creating a transmural voltage gradient that manifests as a ST segment elevation or exaggerated J wave in the ECG. C: Continued exposure to terfenadine results in all-or-none repolarization at the end of phase 1 at some epicardial sites but not others, creating a local epicardial dispersion of repolarization (EDR) as well as a transmural dispersion of repolarization (TDR). D: Phase 2 reentry occurs when the epicardial action potential dome propagates from a site where it is maintained to regions where it has been lost giving rise to a closely coupled extrasystole. E: Extrastimulus (S1–S2 = 250 msec) applied to epicardium triggers a polymorphic VT. F: Phase 2 reentrant extrasystole triggers a brief episode of polymorphic VT. (Modified from reference Fish and Antzelevitch73, with permission)

