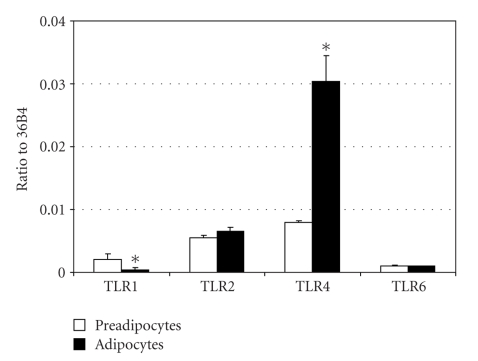
Figure 3.
TLR1, TLR2, TLR4, and TLR6 expression in 3T3-L1 cell line. Relative expression to 36B4 of genes coding for TLR1 and TLR2 was measured by qPCR in preadipocytes (white) or after ten-day differentiation of 3T3-L1 (black). Mann-Whitney analysis was performed between preadipocytes and differentiated adipocytes values (*, P < .05).

