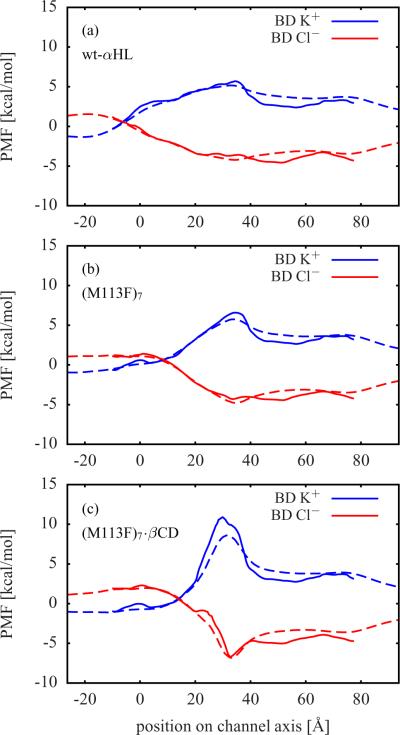
Figure 2.
Single ion PMFs from BD simulations (solid lines) for (a) wt-αHL, (b) (M113F)7, and (c) (M113F)7·βCD extracted from BD simulations via Eq. (4). Also shown in dashed lines are the free energy profiles W(x = 0, y = 0,z) of a single K+ or Cl− located along the channel axis calculated via Eq. (2). The BD PMFs are aligned with the corresponding dashed lines.

