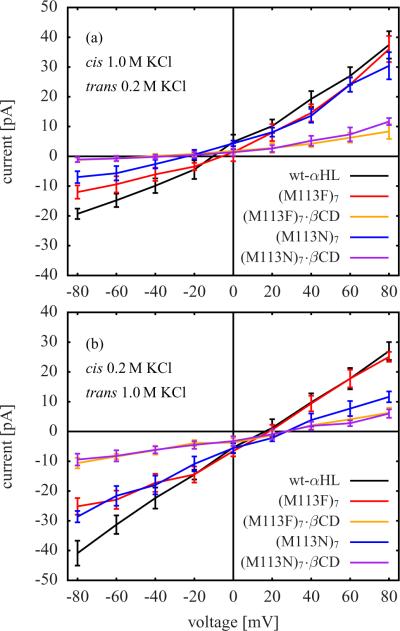
Figure 8.
I-V curves from GCMC/BD simulations with asymmetric salt concentration. (a) 1.0 M KCl on cis side and 0.2 M KCl on trans side (location of cis and trans side is indicated in Figure 1). (b) 0.2 M KCl on cis side and 1.0 M KCl on trans side. The reversal potential of a simulation system is the voltage at the intersection of the corresponding I-V curve with the zero current axis.

