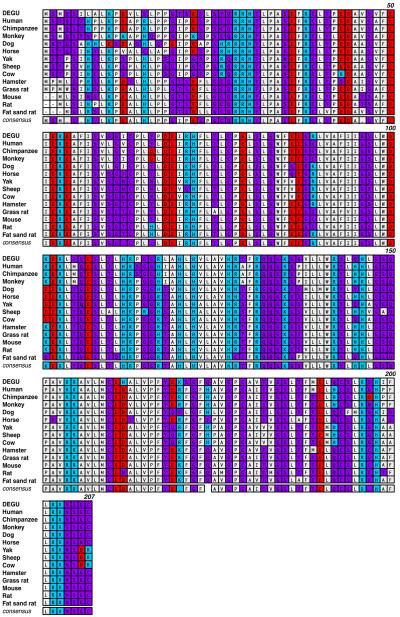
Fig. 5.
Amino acid sequence comparison of AANAT from degu and other mammalian species. The sequence comparison was performed using MacVector ClustalW alignment program and was color-coded based on functionality of the amino acids. Acidic residues were marked in red, basic residues in blue, hydrophobic residues in gray, and hydrophilic residues in purple. The numbers indicated on the upper right lines denote the amino acid positions based on the degu AANAT sequence

