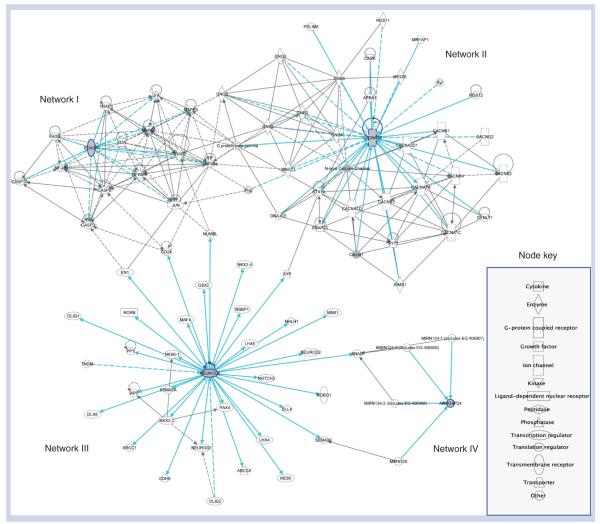
Figure 4. Four networks merged and centered around the four genes (NEUROG3, EDA2R, CACNA1B and ARHGAP24) mapped to private nsSNPs.
The light blue line connection indicates focus genes of interest. No overlapping networks exist between ARHGAP24 and the other three focused genes. Edges are displayed with labels that describe the nature of the relationship between the nodes. The lines between genes represent known interactions, with solid lines representing direct interactions and dashed lines representing indirect interactions. Nodes are displayed using various shapes that represent the functional class of the gene product.

