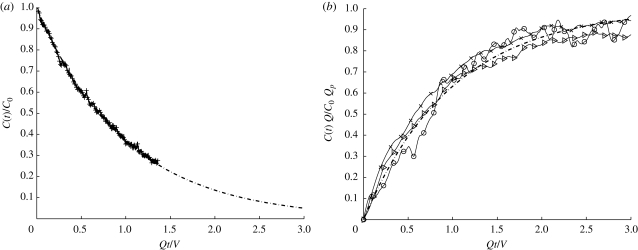
Figure 5.
Mean concentration C(t) within the isolation room as a function of dimensionless time Qt/V for (a) instantaneous release of dye and (b) constant flux of dye added at a rate of Qp = 0.33, 1.33 and 1.67 cm3 s−1. In (a) and (b), the analytical predictions are plotted as a dashed line and defined by equations (2.2) and (2.3), respectively.

