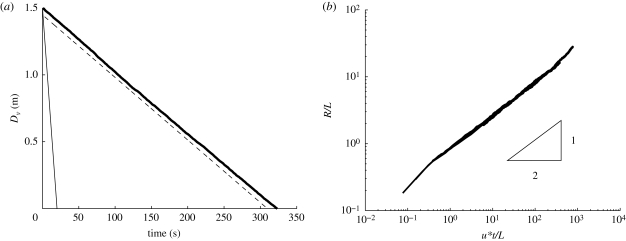
Figure 8.
(a) Average height of a collection of droplets with initial d0 = 50 µm, as a function of time. Full thick line indicates droplet evaporating with turbulence, u* = 0.01 ms−1 and L = 0.05 m. Full thin line is a non-evaporating droplet in no turbulence (analytical solution derived from equation (4.1)). Dashed line is an evaporating droplet in no turbulence (numerical solution from (4.1) with u = 0). (b) Variation of R/LE with u*t/LE for d0 = 50 µm with LE = 0.05 m and u* = 0.01, 0.02, 0.05 ms−1.

