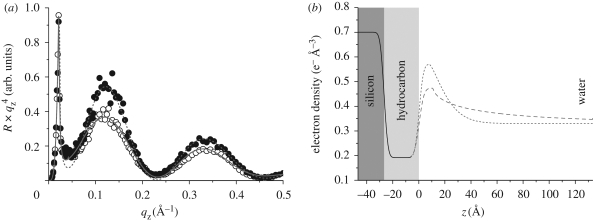
Figure 3.
(a) Reflectivity curves of solid-supported LPS monolayer in Ca2+-free (open circles) and Ca2+-loaded (filled circles) buffers. Solid and dashed lines represent the fits corresponding to the best-matching model parameters. (b) Electron density profiles corresponding to the best-matching model parameters. The interface between hydrocarbon slab and core saccharide slab coincides with z = 0. The core saccharides and O-side chains exhibit a significant difference in the conformation in the absence (dashed line) and presence (dotted line) of Ca2+. Solid line, common model.

