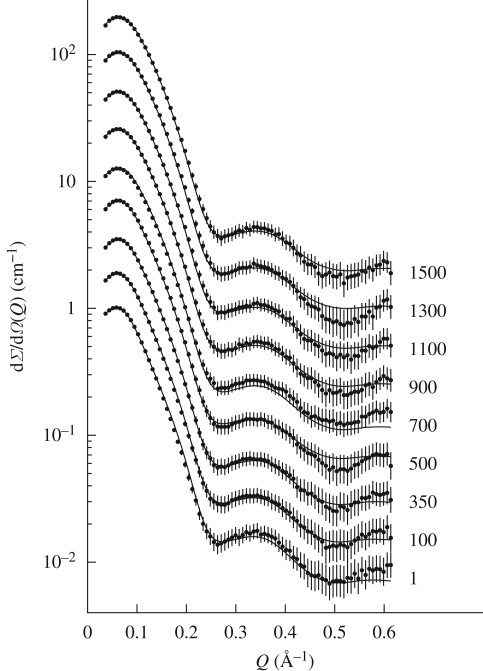
Figure 1.
Set of experimental SAXS curves obtained for lysozyme solution at increasing pressures, reported in bars on the left. Continuous lines represent the theoretical fitting curves obtained using the described global fit model. For the sake of clarity, each curve has been scaled by a factor multiple of 2 cm−1.

