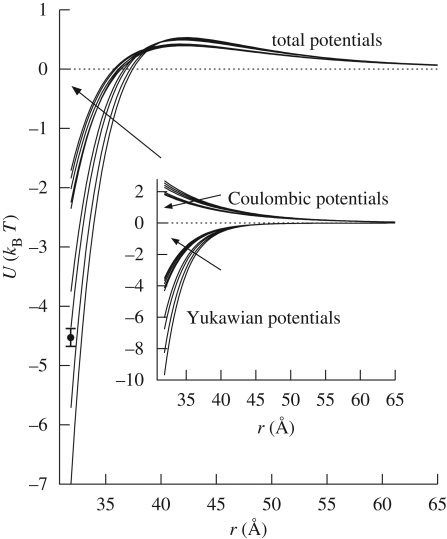
Figure 5.
Interaction potentials calculated at each investigated pressure using fitted parameters. The main figure represents the total interaction potential, while in the inset attractive and repulsive potentials have been reported. Arrows indicate increasing pressures. All the interaction potentials are shown for distances bigger than the protein diameter. An average uncertainty on the curves is represented by the error bar.

