Figure 5.
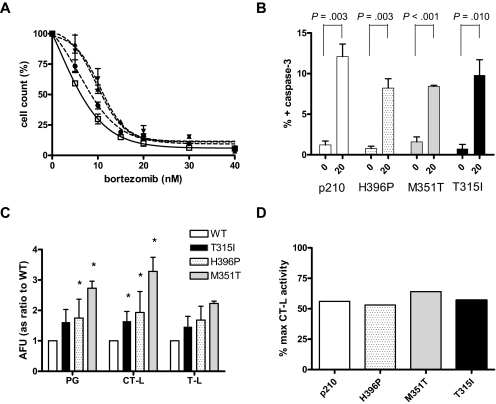
Effect of bortezomib on BCR-ABL+ cell lines. (A) Ba/F3 cells transfected with p210 (□), H396P (▴), M351T (▾) or T315I (●) BCR-ABL and cultured with bortezomib for 24 hours. Viable cell count is expressed as percentage of untreated cells. (B) BCR-ABL+ Ba/F3 cells were cultured either with no drug or treated with bortezomib 20nM for 24 hours and then stained for active caspase-3 as described. A significant increase in anti–active capase-3 staining was seen with bortezomib treatment (P values as shown). There was no significant difference within the untreated or treated groups. (C) Basal proteasome activity in untreated BCR-ABL+ Ba/F3 cells. *Statistical significance was achieved when comparing mutant forms to p210 in PG activity (P < .01 [H396P], P = .013 [M351T]) and CT-L activity (P = .047 [T315I], P = .045 [H396P], P = .038 [M351T]). (D) Residual CT-L activity in BCR-ABL+ Ba/F3 cells after exposure to 20nM bortezomib for 24 hours, expressed as percentage of untreated controls. AFU is arbitrary fluorescence units released per minute, as described. Results in panels A through C represent the mean ± SEM with predicted dose-effect curve in panel A.

