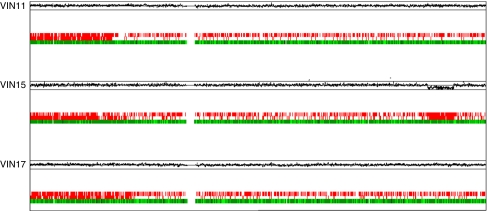
Figure 2.
Copy-neutral LOH at chromosome 6pter-6p21.3 in three high-grade VIN samples. Upper panels indicate lesional/non-lesional copy number ratios plotted on a log2 scale according to chromosomal position. Upper line represents log2(2) and lower line represents log2(0.5). Lower panels depict a comparison of SNP genotypes in VIN and paired normal samples. Single-nucleotide polymorphism loci shown in green indicate calls conserved between the two samples, loci shown in red immediately above indicate LOH in the VIN3 sample and loci shown in red on the top row indicate SNPs not called in the VIN3 sample. Localised areas of low call rates may imply LOH in a subpopulation of cells. Note that sample VIN 15 additionally exhibits LOH accompanied by loss of copy number (deletion) at 6q24.3-6q25.3.

