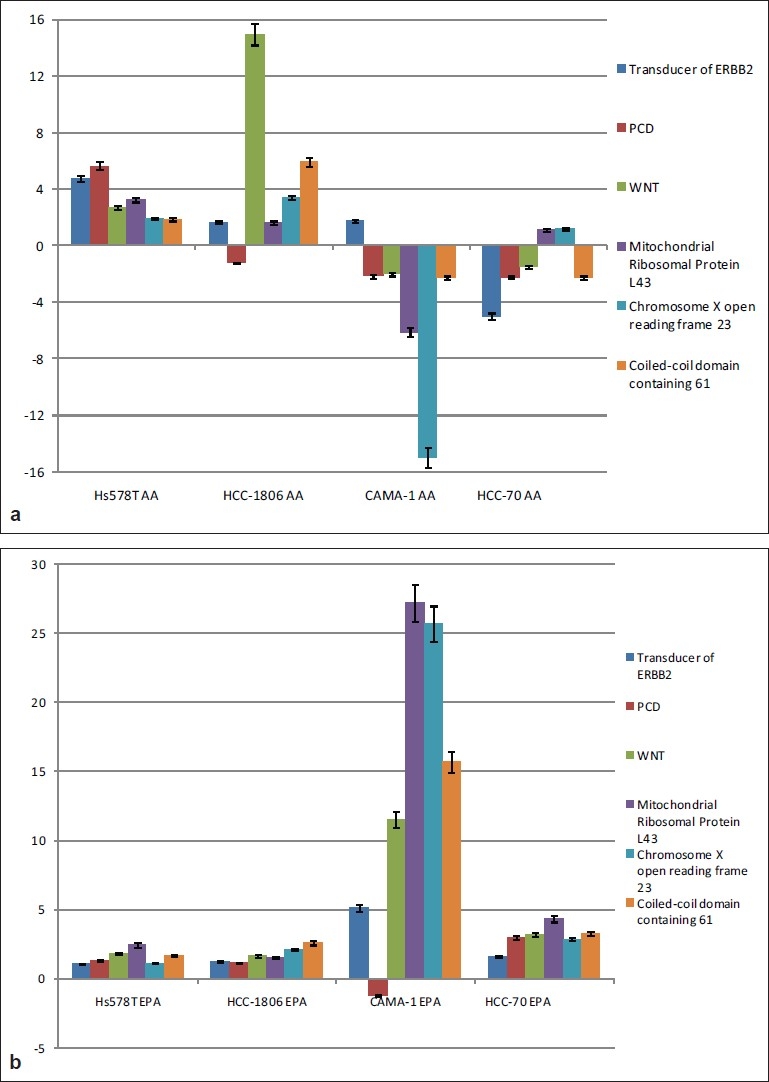
Figure 8.

The gene expression data obtained by Real-time PCR experiment. ER− cells (HCC-1806 and Hs578T) and ER+ cells (CAMA-1 and HCC-70) were incubated with either AA (A.) or EPA (B.) for six hours. At the end of the incubation period, the cells were washed with PBS and TriZol was added. Total RNA was isolated analyzed using RT-PCR. Data points are the mean and standard error of three independent experiments for the same samples used in the microarray experiments. Gene expression data were normalized to GAPDH mRNA that showed no regulation among the various treatments compared to the untreated control cells
