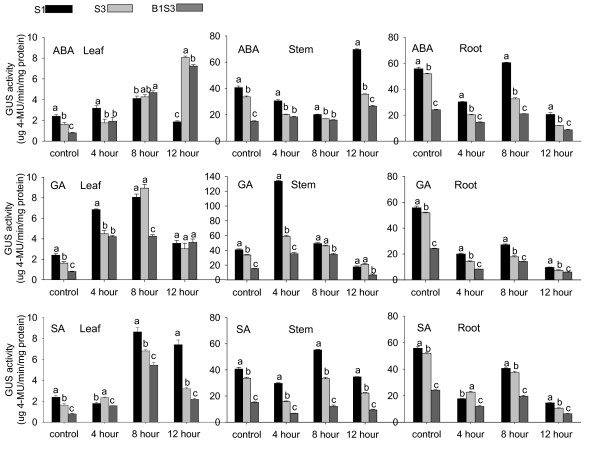
Figure 7.
Estimation of GUS relative activities of various AmCBL1 promoter segments under plant hormone induction. Transgenic tobacco driven by promoter-GUS fusion constructs S1, S3 and B1S3 were chosen for quantification assays. The wild type tobacco without any treatment was used as the control. Details of hormone treatments are given in Table 7. Leaf, stem and root samples taken from transgenic lines were mixed and ground with liquid nitrogen, and then utilised for further experiments. The data were measures of three independent single-copy transgenic lines, and each experiment was replicated three times. The GUS assay is described in Materials and Methods. Significance tests were performed by SPSS 16.0. One way ANOVA was used for statistical analysis. Lowercase letters present the significance of differences. Error bars on the graph represent SE with three replicates.

