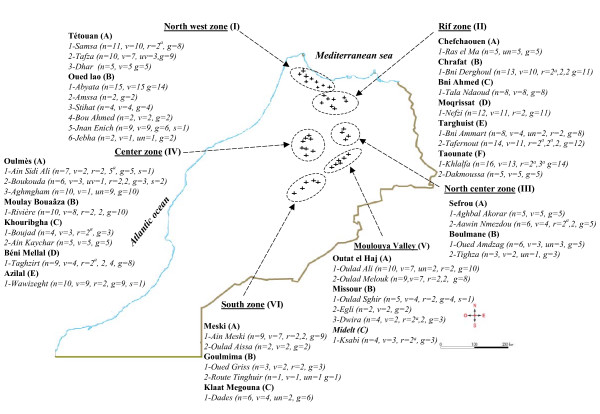
Figure 1.
Sampling locations and fig sample diversity. Six geographic zones were defined I, II, III, IV, V and VI. Letters A, B, C, D, E and F correspond to subzones, and within each subzone, sites are indicated. v = number of sampled local variety names; un = number of sampled unnamed variety; for varieties sampled several times in a site, r is the number of repeats of each local variety name (r = 2, 3, 5 means that 3 varieties have been sampled several times, one 2 times, the second 3 times and the third 5 times); g = number of genotypes sampled; s = number of varieties presenting somatic mutations for fig skin color; a = fig trees under the same variety name and genotype.

