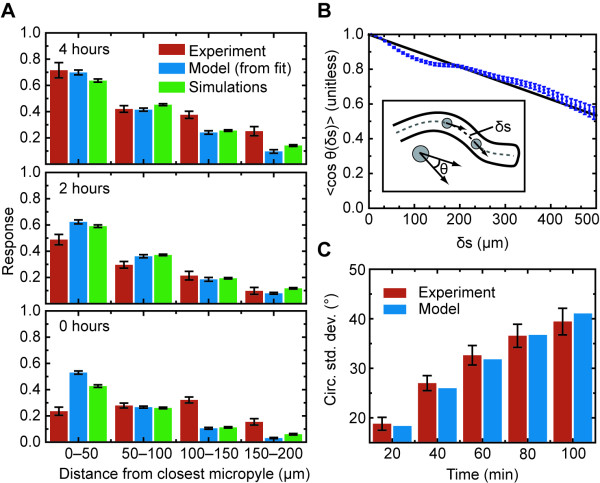
Figure 5.
Validating the model. (A) Comparison of experimental results with the model. The responses are defined as in Fig. 3, where the response is the slope of the regression line between the turning angle θtip and sin θmp, which projects the gradient onto the tip of the pollen tube (see Fig. 3A). The different bars compare pollen tube responses observed in experiment, predicted from the model fit, and produced by simulations of the model. (B) Mean ⟨cosθtip⟩ plotted against δs. We use a linear model to describe this relationship. Inset: Schematic depicting analysis of persistence length, used to set the model parameter σ. The distance between the two points along the tube path is δs, and the angle between their directions of growth is θtip. The cosines of these angles are averaged for all points along the path separated by δs, and over all tube paths, giving the mean ⟨cosθtip⟩ as a function of δs. (C) Comparison between the circular standard deviations (σ0) predicted from the linear fit in panel B, σ2 = 2vδt/L, and the actual values for pollen tubes growing in the absence of ovules. The comparison is plotted for several time intervals. The growth rate, v, was set to 2.76 μm/min.

