
Figure 6.
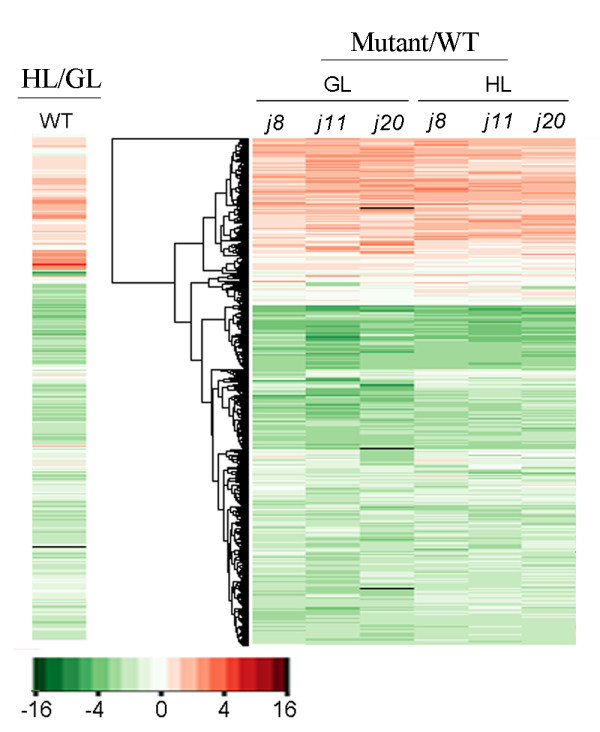
Gene expression-profilings of the DnaJ mutants with comparison to WT. Genes whose expression showed more than a two-fold change (up- or down-regulated) with the p-value less than 0.05 and the B-value more than 2.0 were selected for making the heatmaps using the R program and Bioconductor packages. The values are averages from three independent biological replicates starting from the growth of a new set of plants. The heatmap marked by WT shows the changes of gene expression in WT after 6 h illumination at 1000 μmol photons m-2 s-1 against 6 h illumination at 120 μmol photons m-2 s-1. The heatmaps marked by the names of the DnaJ mutant show the changes of gene expression in each mutant against WT under both GL and HL conditions after 6 h illumination. WT, wild-type; GL, 120 μmol photons m-2 s-1 growth light; HL, 1000 μmol photons m-2 s-1 high light. (red, upregulated; green, downregulated; black, missing value).