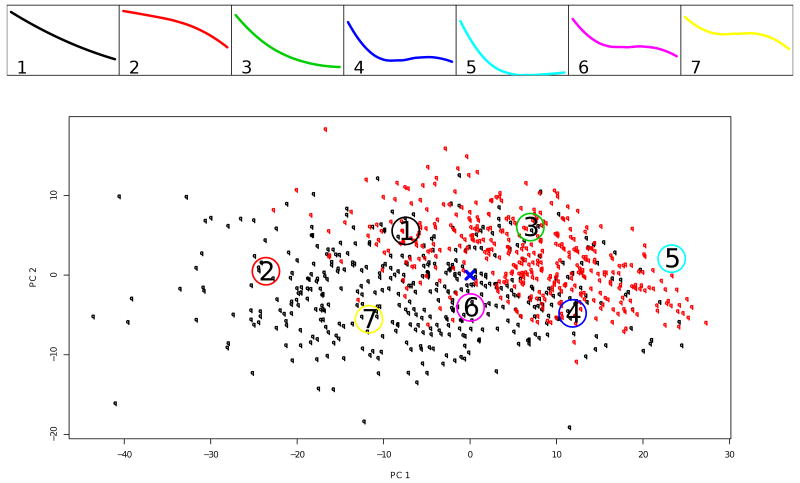
Figure 1.
Study A: k = 7 principal points for the trajectories of symptoms severity during acute treatment. The top panels shows the profiles corresponding to the estimated principal points. The bottom panel shows individual trajectories for the patients in the acute treatment phase represented by their random coefficients from model (5); in red are those who were responders to acute treatment and randomized in the discontinuation phase. For the purposes of graphing, the 4-dimensional vectors of random coefficients are projected onto the first two principal components. The large numbered circles present the estimated principal points.

