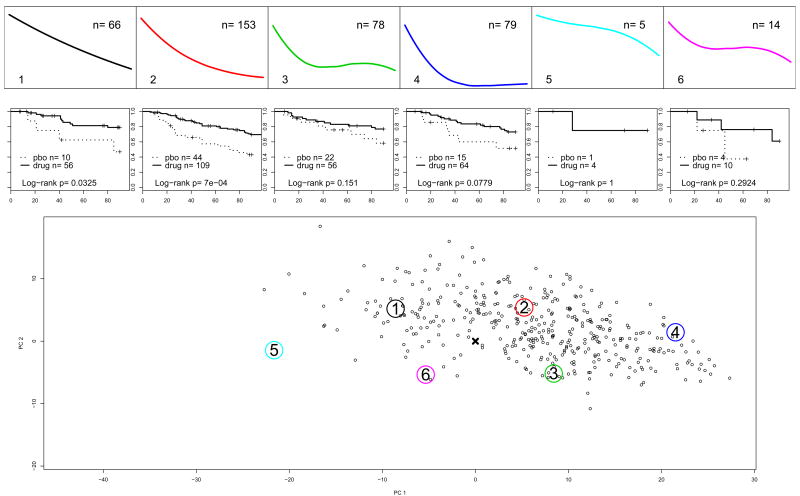
Figure 3.
Study A: Survival without relapse in the first 14 weeks after response to acute treatment for subjects in k = 6 partitions. The top panels show profiles of the principal points for the distribution of the trajectories of symptoms change during acute treatment, Phase 1 of the study. The bottom panel shows the Phase 1 trajectories of symptoms decline only for the responders to acute treatment. The large numbered circles present the estimated principal points. The middle panels show Kaplan-Meyer survival curves during the 14 weeks after randomization into Phase 2 and p-values for Log-rank tests.

