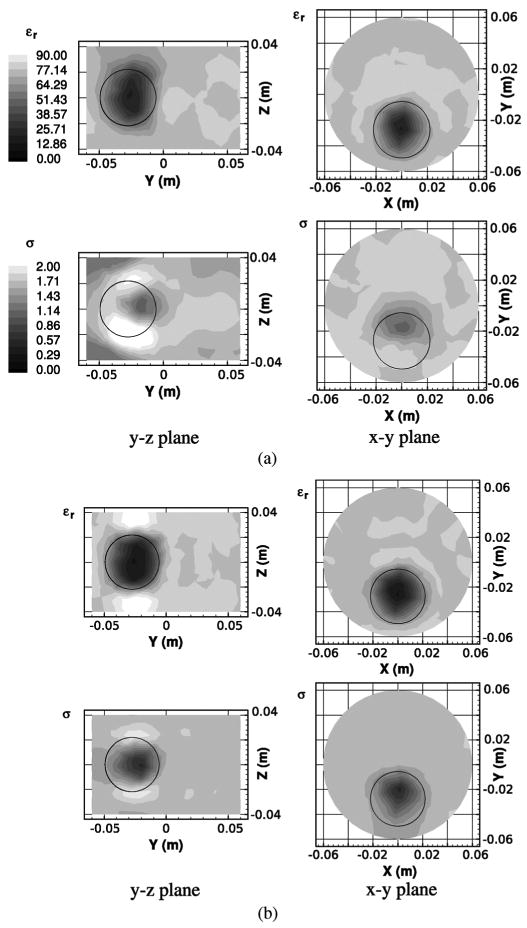
Fig. 6.

Cross-sectional relative permittivity (top row) and conductivity (bottom row) images of the reconstructed dielectric profiles using the scheme A antenna configuration (scalar-3D algorithm) for the (a) scalar-3D and (b) vector-3D algorithms. Circles show the exact location of the embedded heterogeneity in each cross-section.
