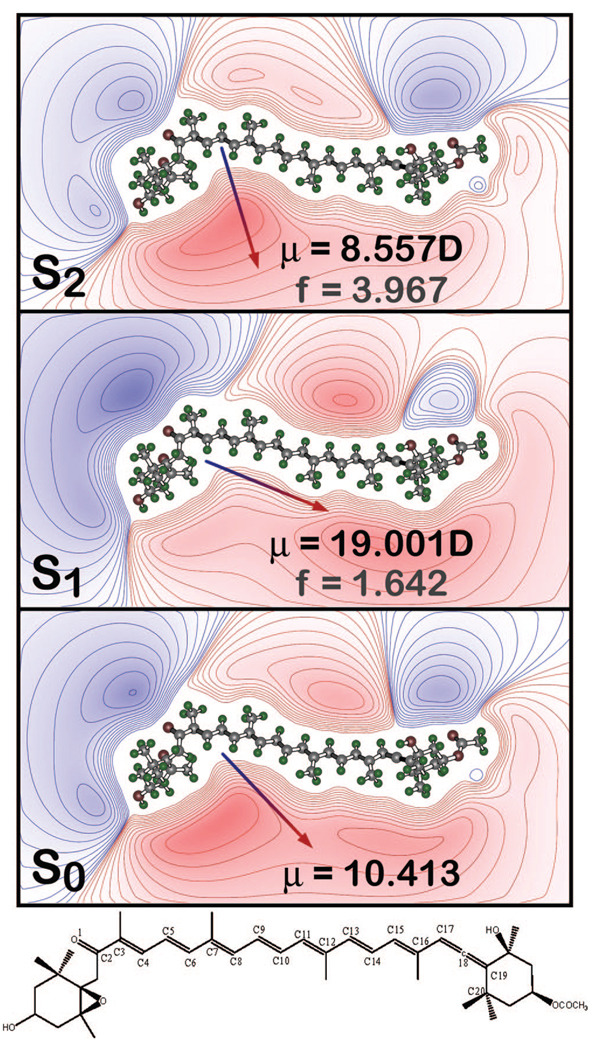
Figure 6.
Charge shift upon excitation into the low-lying strongly allowed state based on the mulliken charges from the SACCI-CISD calculations. The arrows (head positive) indicate the dipole moment (S0) or the changes in the dipole moments upon excitation (S1 and S2). Red contour lines indicate regions of excess positive charge and blue contour lines indicate regions of excess negative charge. The chemical stick figure of Fx is shown at the bottom. The distance between O1 (carbonyl oxygen) and C10 is ~9.5 Å and between O1 and C17 (of the allene) is ~18 Å.

