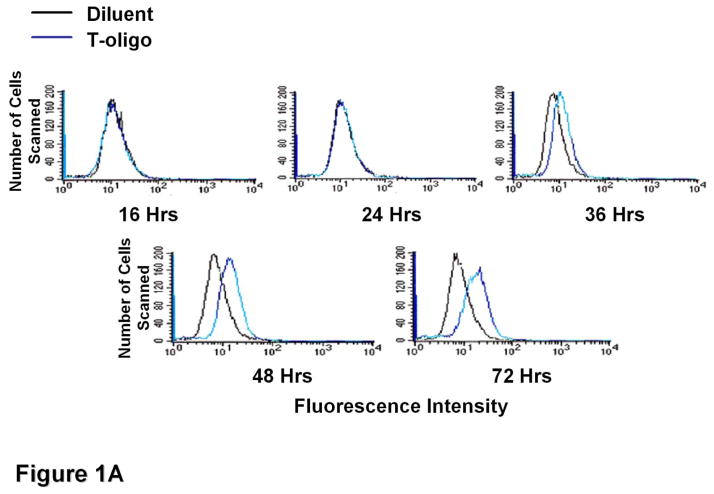
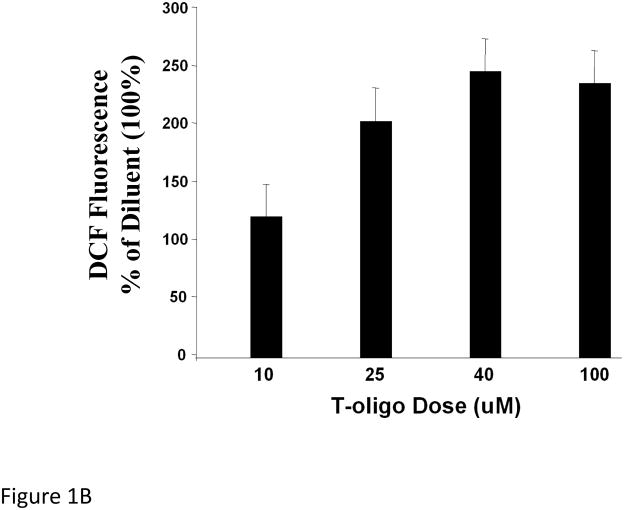
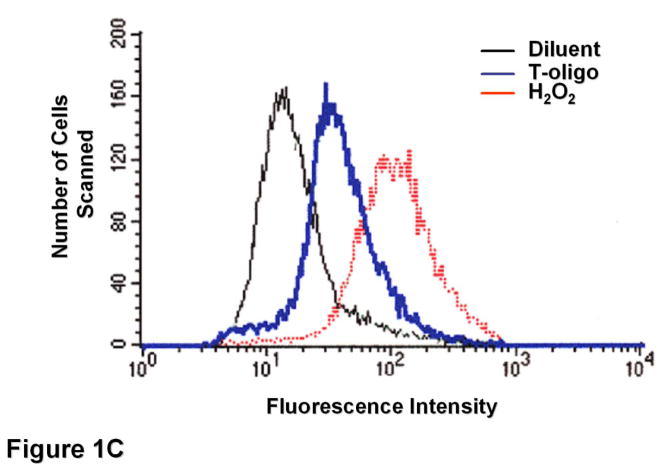
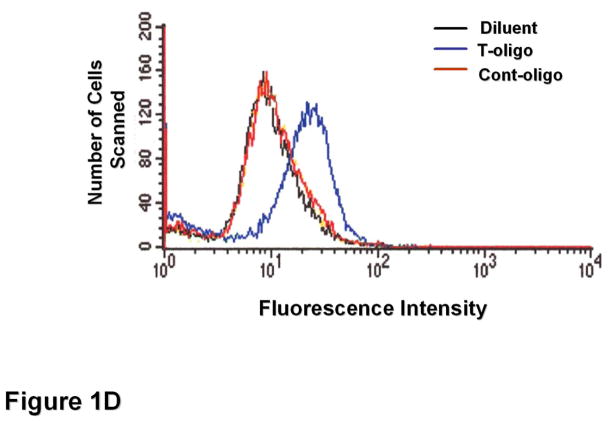
Figure 1. T-oligos stimulate intracellular ROS levels.
(A) Normal newborn human fibroblasts were stimulated with T-oligo or diluent and ROS levels were determined using the DCF assay[70, 74, 114, 115]. Within 36 hours intracellular ROS levels were induced only in T-oligo-treated cultures and the levels increased up to 72 hours when the experiment was terminated. One of five representative experiments is shown. (B) Fibroblasts were stimulated as above with increasing T-oligo concentrations and ROS levels were determined 72 hours after stimulation. Maximal induction of ROS was observed at T-oligo concentrations of ≥ 40 μM. One of two reproducible experiments is shown. (C) Fibroblasts were stimulated with T-oligo as above or with 1 mM H2O2 for 15 minutes to examine the possibility of DCF probe saturation. H2O2 increased fluorescent intensity beyond that of T-oligo-induced fluorescence, confirming that DCF fluorescence was not saturated. One of three reproducible experiments is shown. (D) Fibroblasts were stimulated with T-oligo (40 μM), Cont-oligo (40 μM) or diluent as above and ROS level was determined 72 hours after treatment. Only T-oligo induced intracellular ROS levels. One of five experiments with comparable results shown.


