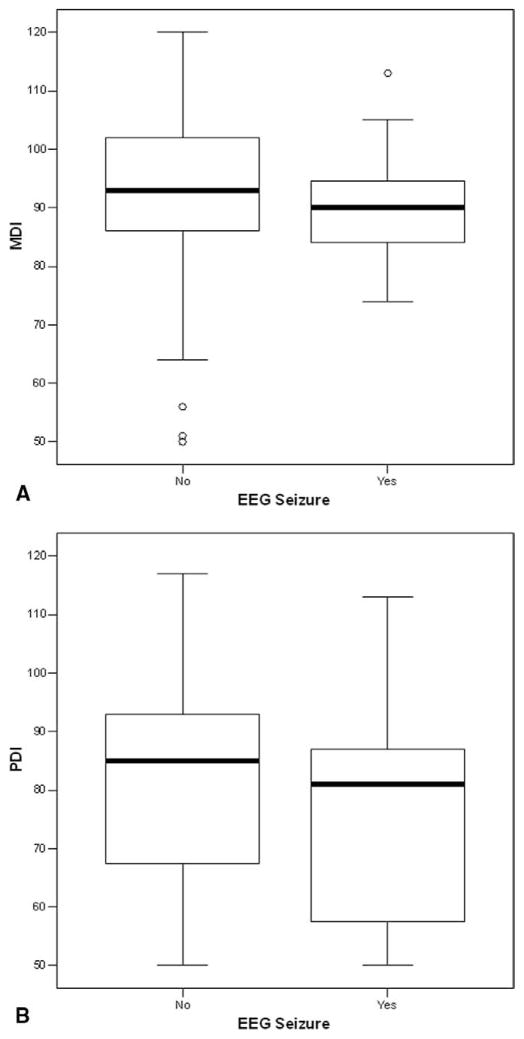
Figure 1.
A, Box plot of MDI scores for all patients (n = 114), stratified by the occurrence of a seizure. B, Box plot of PDI scores for all patients (n = 114), stratified by the occurrence of a seizure. Within a box, the solid bar represents the median value, the upper boundary of the closed box represents the 75th percentile, and the lower boundary represents the 25th percentile. The vertical lines extend to the 10th and 90th percentiles, with outliers plotted as circles.

