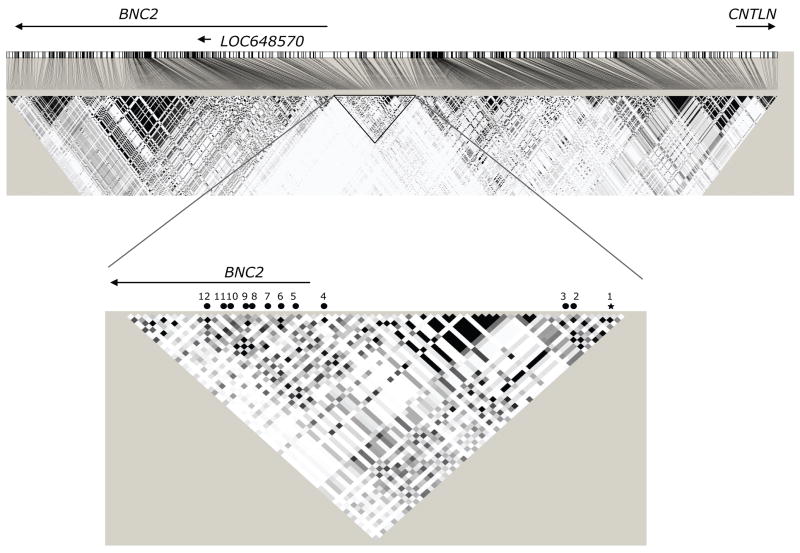
Figure 2.
Map of associated regions on 9p22.2 (nucl. 16655021-17155021). The top panel shows the LD blocks around rs3814113 (±250 kb) for SNPs with MAF≥ 0.05 based on Hapmap CEU data. Squares on the LD block indicate the correlation (r2) between SNPs on a greyscale (darker squares = higher correlations). Approximate location of BNC2 (nucl. 16860786-16399502), CNTLN (nucl. 17125038-17493915) and LOC648570 (nucl. 16777433-16775576) were inferred from the NCBI reference assembly (solid line). The lower panel shows the highlighted LD block in greater detail. The star indicates the location of the most strongly associated SNP rs3814113. The black circles show the position of the other 11 SNPs that reached genome wide significance. The numbers refer to the SNP identifiers in Supplementary Table 2.

