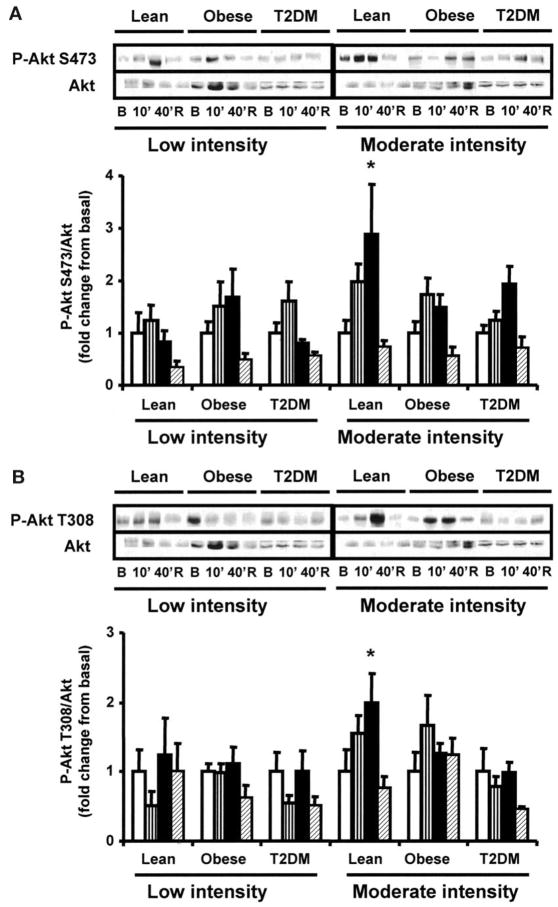
FIG. 6.
Akt phosphorylation. Biopsies were done at basal (□), after 10 (▥) and 40 min (■) of exercise, and 150 min postexercise (▨). Akt-Ser473 (A) and Thr308 (B) were measured as described in research design and methods. Data are means ± SE in 8 lean, 8 obese, and 12 type 2 diabetic (T2DM) subjects. *P < 0.05 vs. basal of respective group. Blots are shown for one subject/group. B, basal; R, rest postexercise.

