
Figure 2. FLIM imaging.
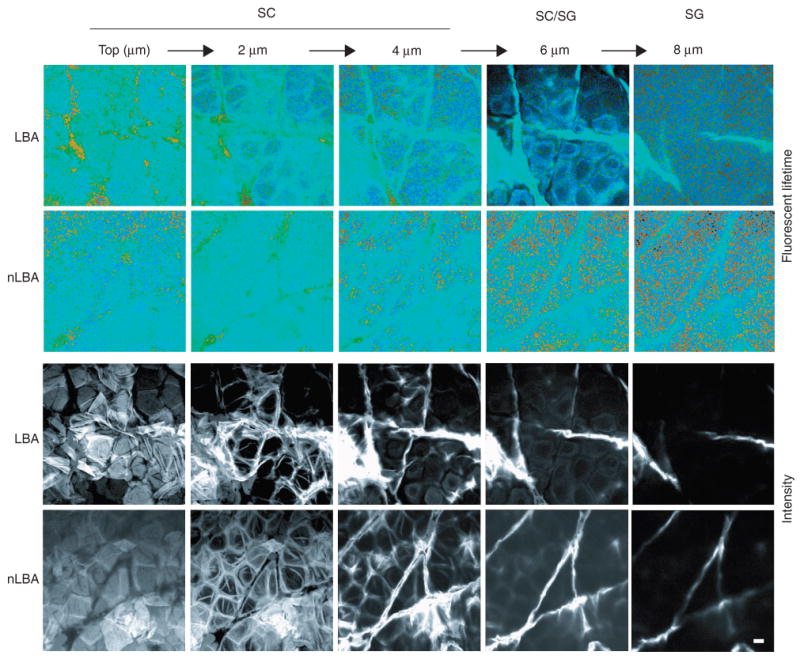
Fluorescence Lifetime Imaging (FLIM) of unperturbed stratum corneum treated with LBA vs normalized LBA (nLBA), used as a control. A series of five optical sections is shown, starting at the skin surface (top) and extending to the SG (8 μm). Images are shown en face, and pH is measured by assessing the lifetime of the pH-sensitive moderator BCECF. Intensity imagines (lower two rows) are compared with lifetime images (upper two rows). Light blue represents more neutral values, whereas green and yellow represent more acidic values. Amorphous acidic collections are seen on the surface of the LBA but not on the nLBA-treated skin, likely corresponding to topically applied LBA. Owing to LBA, extracellular acidity is more visible in the LBA-treated SC, although acidification diminishes at the SG, likely representing decreased LBA diffusion at deeper SC/SG levels. Bar = 10 μm.