
Fig. 5.
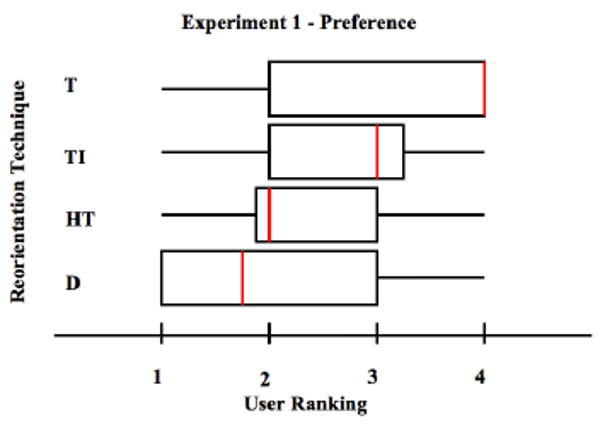
Experiment 1–User rated preference scores from 1 (most preferred) to 4 (least preferred). Standard box-and-whisker plots with the median in red.
Official websites use .gov
A
.gov website belongs to an official
government organization in the United States.
Secure .gov websites use HTTPS
A lock (
) or https:// means you've safely
connected to the .gov website. Share sensitive
information only on official, secure websites.
Experiment 1–User rated preference scores from 1 (most preferred) to 4 (least preferred). Standard box-and-whisker plots with the median in red.