
Fig. 4.
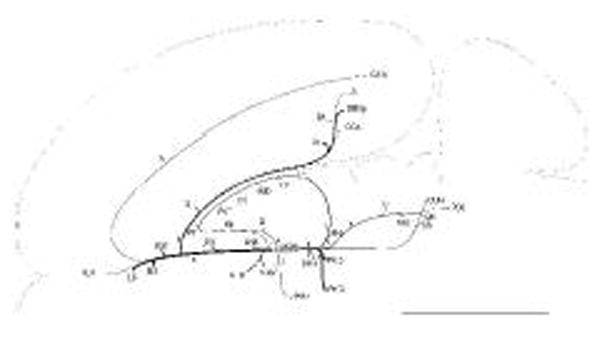
General organization of projections from the LHAsfa. The magnitude of each pathway is roughly proportional to the thickness of the line representing it. The numbers 1–6 refer to main axonal pathways described in the text. The flatmap is adapted from Swanson (2004).