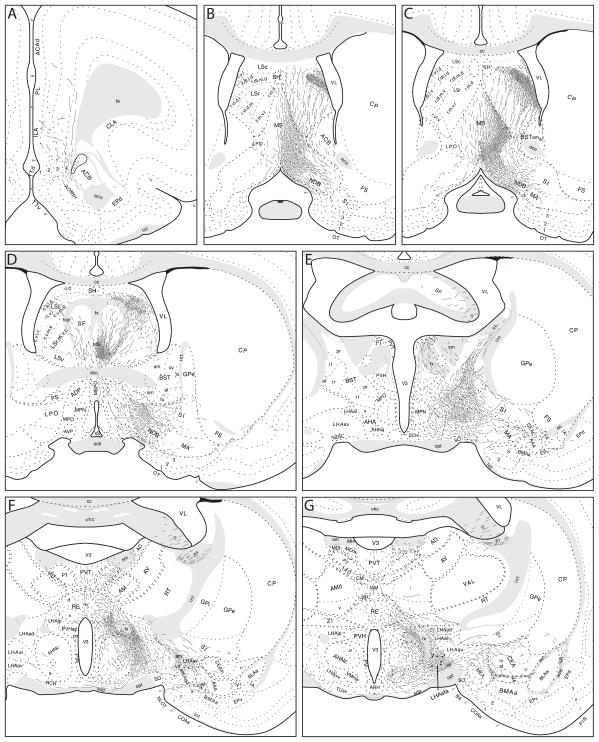
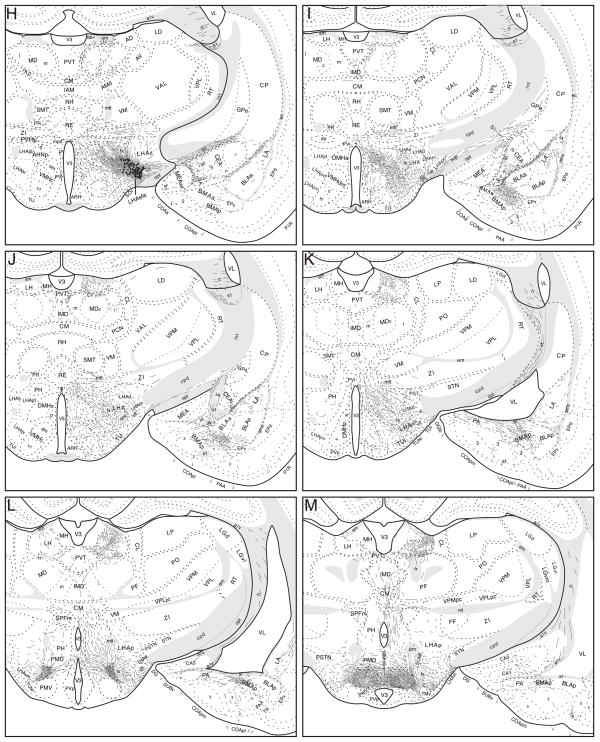
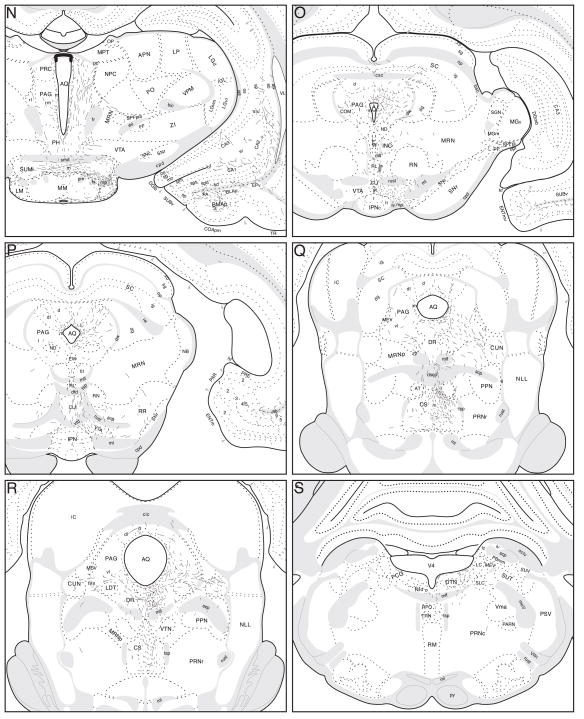
Fig. 5.
Projections from the LHAsfa. The distribution of PHAL-labeled axons (thin black lines) in experiment LHAsfa94 was plotted onto a series of rat brain reference templates derived from Swanson (2004), arranged from rostral to caudal (A-S). The black dots in G and H indicate the injection site.


