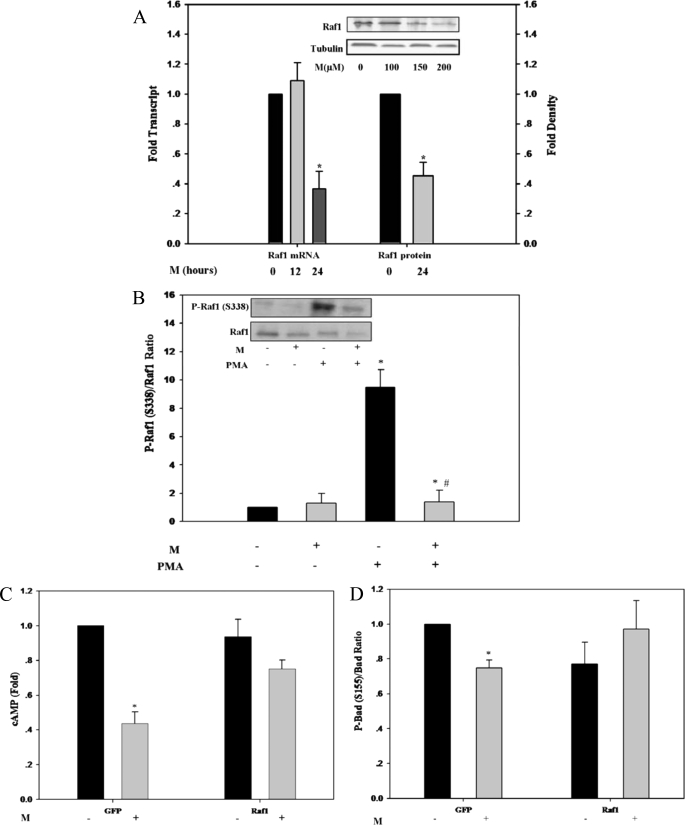
FIGURE 4.
Suppression of Raf1 by M analogs. A, Raf1 transcript and Raf1 protein levels of M-treated Jurkat cells, determined by quantitative RT-PCR relative to tubulin expression (left ordinate) and by SDS-PAGE/Western blot analysis relative to tubulin levels (right ordinate), respectively. Raf1 transcript and protein levels of extracts of non-treated cells are defined as 1.0. Values are mean ± S.E. of three independent experiments. *, significant as compared with non-treated controls (p < 0.05). Inset: representative blots. B, Raf1 and P-Raf1(Ser-338) of M-treated Jurkat cells, determined by SDS-PAGE/Western blot analysis, in the presence or absence of 50 nm PMA added 1 h prior to sampling. The P-Raf1(Ser-338)/Raf1 ratio of extracts of non-treated controls is defined as 1.0. Values are mean ± S.E. of three independent experiments. *, significant as compared with non-treated controls (p < 0.05); #, significant as compared with PMA-treated controls (p < 0.05). Inset: representative blots. C, cAMP content of M-treated COS-1 cells, transfected with GFP-Raf1 expression vector or with the respective GFP plasmid as indicated. Values are corrected for transfection efficiency, estimated by the percentage of GFP-expressing cells. The cAMP content of extracts of non-treated controls is defined as 1.0. Values are mean ± S.E. of four independent experiments. *, significant as compared with non-treated controls (p < 0.05). D, P-Bad(Ser-155)/Bad ratio of M-treated COS-1 cells, transfected with GFP-Raf1 expression vector or with the respective GFP plasmid as indicated. The P-Bad(Ser-155)/Bad ratio of extracts of non-treated controls is defined as 1.0. Values are mean ± S.E. of four independent experiments. *, significant as compared with non-treated controls (p < 0.05).

