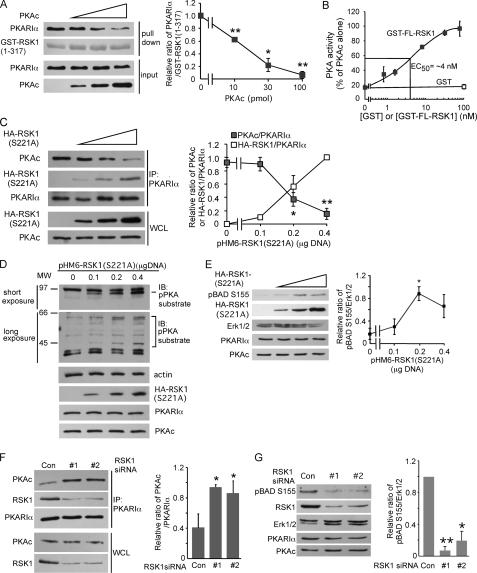
FIGURE 4.
Competition between PKAc and RSK1 for association with PKARIα regulates PKA activity. A, PKAc competes with RSK1-(1–317) for binding to PKARIα. PKARIα (10 pmol) was preincubated with different indicated amounts of PKAc to form the holoenzyme before mixing with glutathione resin pre-bound to GST-RSK1-(1–317) (5 μg) for the pulldown assay. GST-RSK1-(1–317) was stained with Coomassie Blue. The panel on the right is quantification of the ratio of the band intensities of PKARIα relative to GST-RSK1 from three similar experiments. *, p < 0.05; ** p < 0.01, Student's unpaired t test analysis. B, GST full-length RSK1 (GST-FL-RSK1) competes with PKAc for PKARIα and decreases the formation of the PKA holoenzyme. PKAc (2 nm final concentration) and increasing indicated concentrations of GST-FL-RSK1 (or GST 100 nm) were added to PKARIα (3 nm). After incubation of the mixture for 1 h, formation of the PKA holoenzyme was monitored by measuring PKAc activity as described under “Experimental Procedures.” C, increasing expression of HA-RSK1 (S221A) decreases the association of endogenous PKAc with PKARIα. HEK293T cells were transfected with the indicated different amounts of plasmid expressing HA-RSK1 (S221A). Cell lysates were immunoprecipitated (IP) with anti-PKARIα antibody. The right hand panel shows the quantification of band intensities of PKAc or HA-RSK1 as a ratio of the band intensities of PKARIα from 3 similar experiments. *p < 0.05; **, p < 0.01. D–E, overexpression of HA-RSK1 (S221A) activates PKA. Experiments were the same as in panel C, except that the cell lysates were probed with anti-phospho-PKA substrate (D) or anti- phospho-BAD Ser-155 antibodies (E). In D, a representative of three similar experiments is shown. IB, immunoblot. In E, the right-hand panel shows quantification of band intensities of phospho-BAD-Ser-155 and Erk1/2 from three experiments; *, p < 0.05. F, silencing of RSK1 increases the interactions between endogenous PKAc and PKARIα. B82L cells were transfected with RSK1-specific siRNA #1 (20 nm) or #2 (40 nm) for 56 h and then serum-starved overnight. The cell lysates were immunoprecipitated with anti-PKARIα antibody. The right-hand panel shows quantification of band intensities of PKAc as a ratio of PKARIα band intensities from three experiments. *, p < 0.05, as compared with control. G, silencing of RSK1 decreases phosphorylation of BAD on Ser-155. RSK1 was silenced as in F. Quantified band intensities of phospho-BAD-Ser-155 and Erk1/2 from three experiments are shown on the right. *, p < 0.05; **, p < 0.01, as compared with control siRNA (Con). WCL, whole cell lysate.

