FIGURE 1.
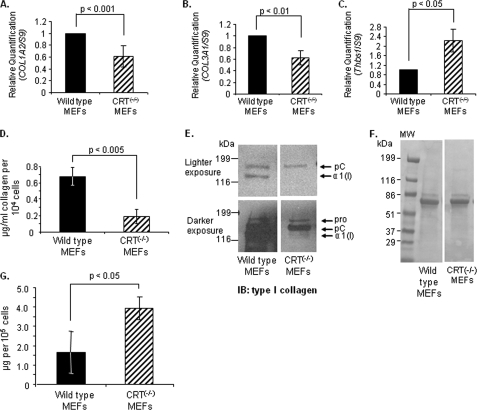
Cells deficient in CRT expression have reduced collagen transcript and soluble collagen. A–C, wild type and CRT−/− MEFs were cultured in 10% FBS for 48 h and then 12 h in 0.5% FBS. RNA was harvested, and transcript levels of type I collagen, Col1A2 (A), type III collagen, Col3A1 (B), and Thbs1 (C) were measured by quantitative real time PCR. Values represent the mean expression levels normalized to S9 expression ± S.D. (for Col1A2, n = 8; for Col3A1, n = 5; for Thbs1, n = 4; each “n” was performed in triplicate). Values for wild type cells were set to 1. D–F, wild type and CRT−/− MEFs were cultured in 10% FBS for 48 h and then 72 h in 0.5% FBS. Conditioned media were collected after the 72 h. D, conditioned media were assayed for levels of soluble collagen using the SircolTM assay. Soluble collagen levels were normalized to cell number. Results are expressed as the mean ± S.D. (n = 3 separate experiments performed in triplicate). E, equal volumes of conditioned media were immunoblotted (IB) for type I collagen. A representative blot is shown with a lighter exposure to visualize collagen in the wild type MEFs and a darker exposure to visualize collagen in the CRT−/− MEFs. All four panels are from the same membrane. A representative blot is shown (n = 3 separate experiments). The three forms of the α(I) chain of collagen I recognized by the antibody are indicated as follows: Pro is the unprocessed form with the N- and C-propeptides; pC is collagen with the N-propeptide cleaved; and α1(I) is the fully processed α(I) band. F, membrane from E was stained with Ponceau S to demonstrate protein loading. G, cells were grown for 24 h in 10% FBS and then for 24 h in serum-free and phenol-free DMEM. Conditioned media were collected in the presence of protease inhibitors and centrifuged, and the supernatant was measured for total protein by the Bradford assay. Total protein was normalized to cell number.

