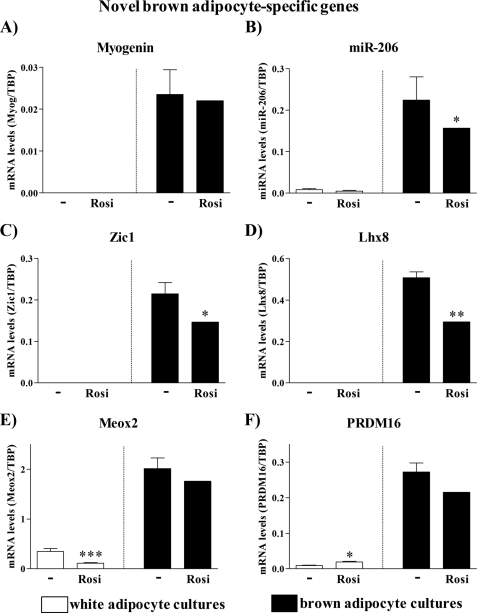
FIGURE 4.
Expression levels of novel brown adipocyte marker genes in control and rosiglitazone-stimulated cultures of white and brown adipocytes. Primary cultures of white and brown adipocytes were grown as above (Fig. 3). Gene expression was analyzed by quantitative reverse transcription-PCR. Myogenin (A), miR-206 (B), Zic1 (C), Lhx8 (D), Meox2 (E), and PRDM16 (F) levels in control and rosiglitazone-stimulated white and brown adipocytes on day 5 of culture are shown. The expression levels of the genes studied were normalized to the TBP levels in each sample. The values represent means ± S.E. of four independent experiments, each performed in duplicate. Expression levels in the rosiglitazone-treated brown adipocyte cultures were set in each experiment to the mean of its normalized values, and the levels in other brown and white adipocytes were expressed relative to this value in each individual experiment. Statistical analysis is as in Fig. 3. *, p < 0.05; **, p < 0.01; ***, p < 0.001.

